Radiation Inspection Software for Enusa Industrias
Maedcore develops a radiation analysis app for Enusa Industrias Avanzadas with 3D maps, interactive charts and automated report generation.
Written by Maedcore
Radiation Inspection and Analysis Software for Enusa Industrias Avanzadas
Executive summary: Maedcore developed for Enusa Industrias Avanzadas S.A., S.M.E. — a Spanish nuclear sector company — a specialised application for evaluating and analysing radiation measurements. The platform replaces manual recording and analysis processes with an automated solution that generates real-time visualisations through interactive charts, dynamic tables and three-dimensional maps. The result is a significant reduction in data processing time, greater accuracy in reports and improved support for decision-making in highly regulated environments.
The Client: Enusa Industrias Avanzadas
Enusa Industrias Avanzadas S.A., S.M.E. is a Spanish public company in the nuclear sector, specialising in the manufacture of nuclear fuel and the management of radioactive materials. It operates in a highly regulated environment where precision in radiation measurement and data traceability are non-negotiable requirements.
The need was clear: the process of measuring, recording and analysing radiation data was manual, tedious and susceptible to human error. The solution needed to industrialise and automate that process without compromising reliability.
The Challenge: From Raw Data to Safe Decisions
Radiation inspection processes generate large volumes of data that must be:
- Accurately recorded at the moment of measurement.
- Processed and correlated with the geographical position of the measurement point.
- Visualised in a comprehensible way for technicians and managers.
- Exported in structured reports for audits and regulatory compliance.
Doing this manually — with spreadsheets, paper notes and subsequent processing — meant loss of time, risk of transcription errors and delays in the availability of results for decision-making.
The Solution: Bespoke Radiation Analysis Platform
Maedcore designed and developed a desktop application with the following capabilities:
Real-Time Data Analysis and Visualisation
The platform processes data imported from measurement equipment and presents it in three complementary visual formats:
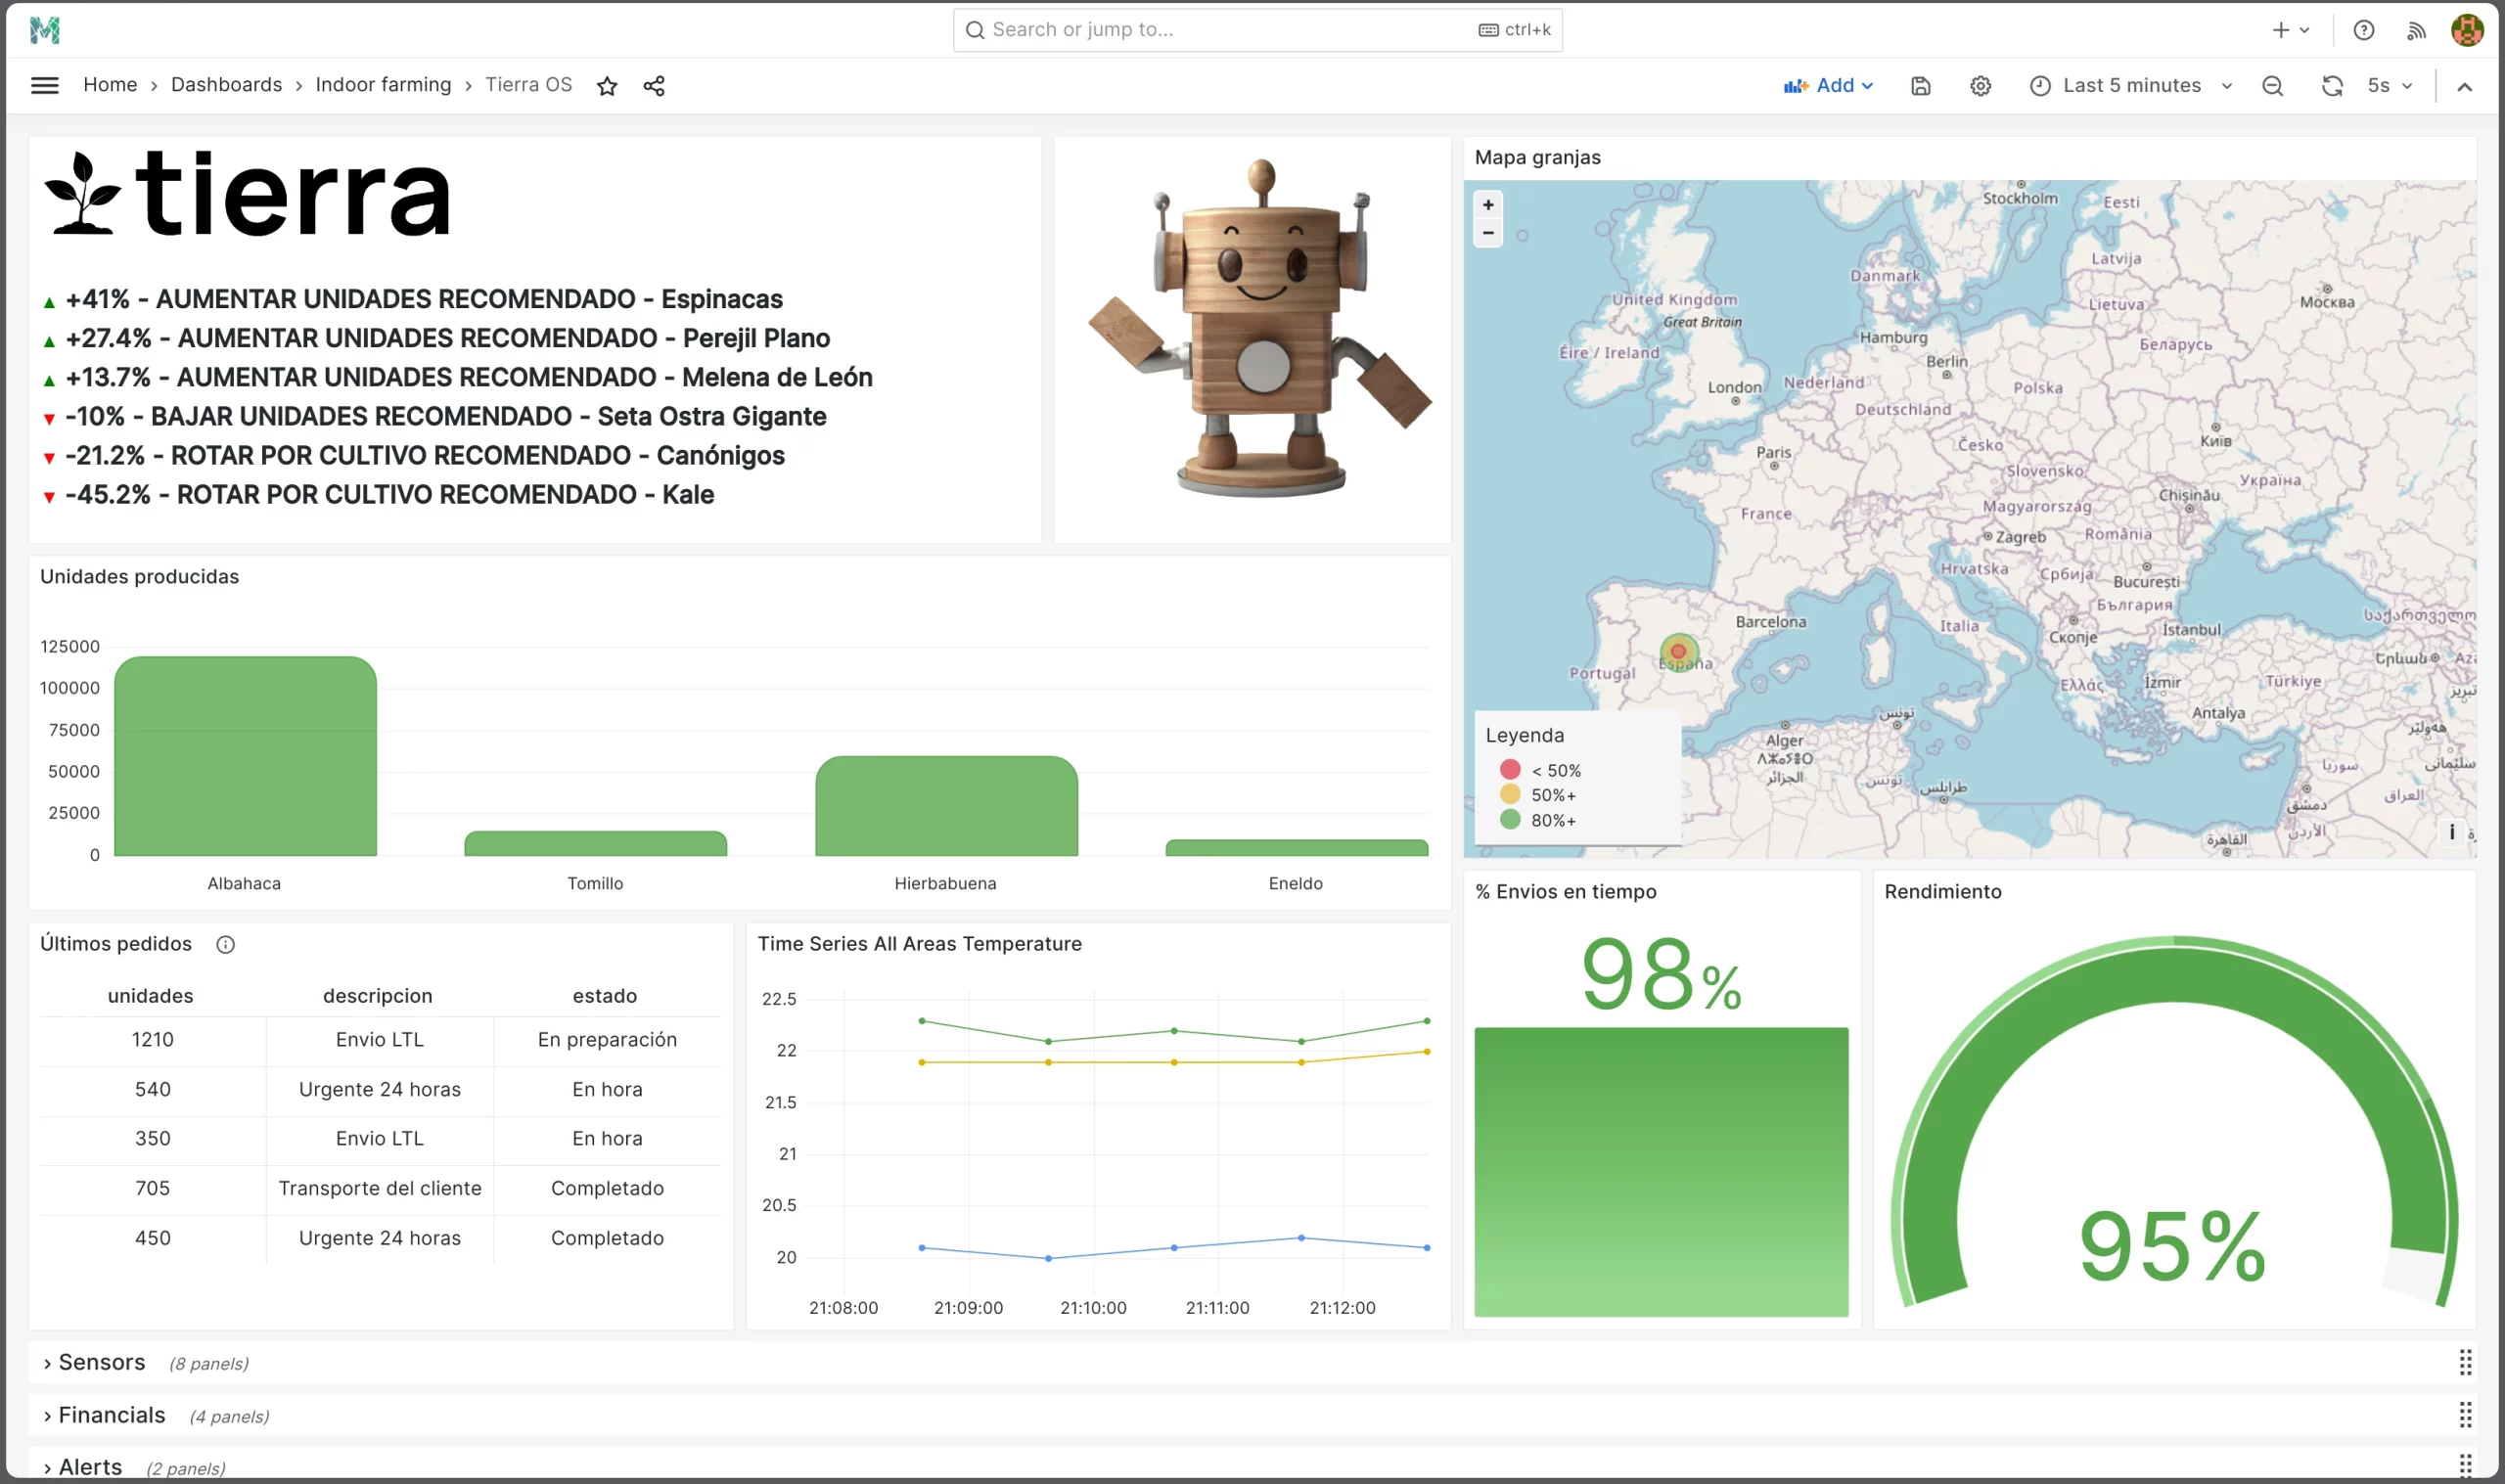
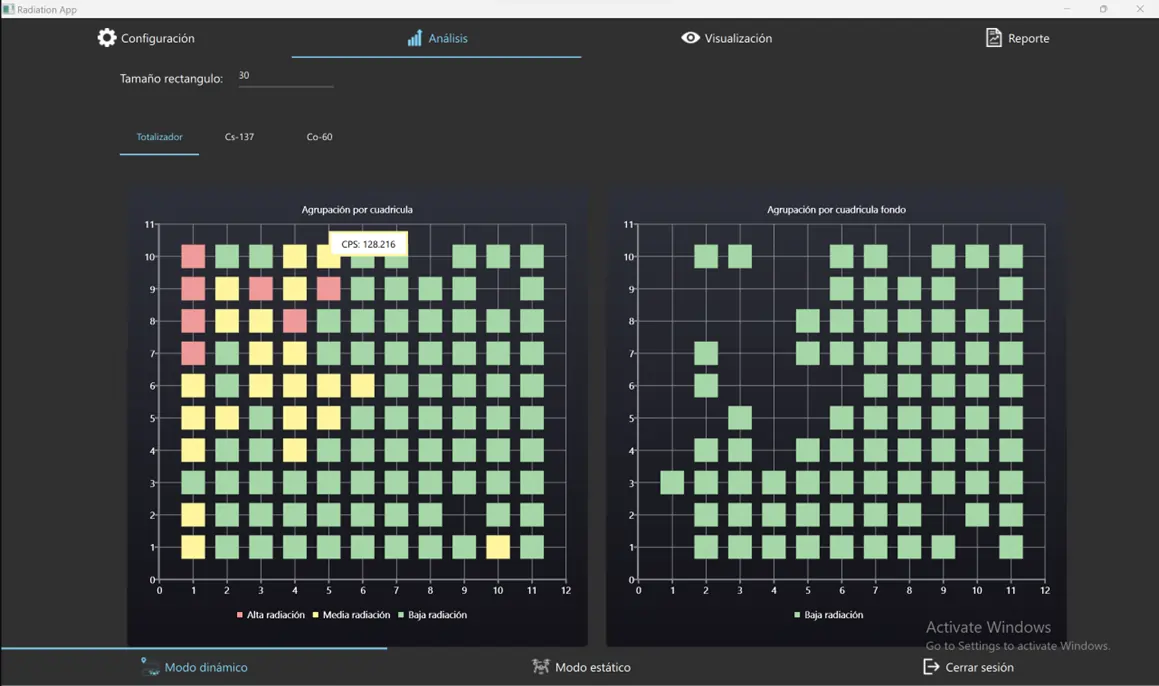
Interactive charts: temporal and comparative representations that allow patterns, radiation peaks and trends to be identified over time or between different measurement points.
Dynamic tables: tabular view with flexible filters and sorting to compare specific measurements, zones or periods.
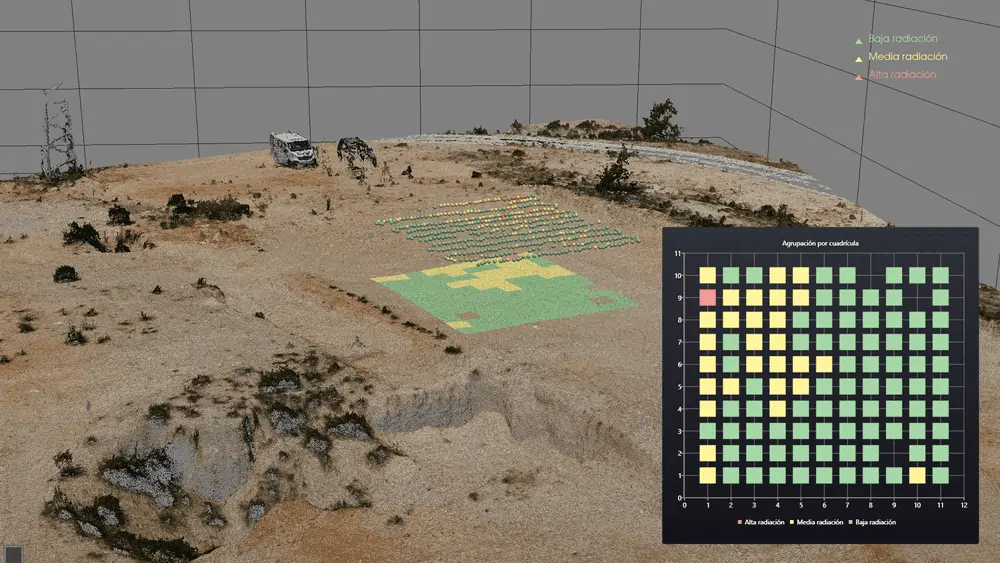
3D maps: the most distinctive feature of the platform. Radiation data is linked to spatial coordinates and represented in a three-dimensional map showing the geographical distribution of radiation in the inspected area, enabling an intuitive spatial understanding impossible with tabular data.
Report Process Automation
The system automatically generates structured reports from imported data, including charts, tables and 3D maps. This eliminates the manual report preparation work, reducing post-inspection time and eliminating transcription errors.
Intuitive Interface for Operators of Different Profiles
The user interface design was developed so that both field technicians and managers with less technical experience can use all features without prolonged specialist training.
Key Platform Features
| Feature | Description |
|---|---|
| Data import | Compatible with Enusa measurement equipment export formats |
| Interactive charts | Configurable by parameter, zone and time period |
| Dynamic tables | Filtering, sorting and Excel export |
| 3D map | Spatial representation of measurements with colour coding by radiation level |
| Report generation | Automatic PDF export with integrated charts and maps |
| Adapted interface | Usable by operators without advanced technical training |
Benefits Gained by Enusa
- Greater accuracy: process automation eliminates human errors in data transcription.
- Operational efficiency: post-inspection processing time was drastically reduced by automating report generation.
- Improved visual understanding: 3D maps allow high-radiation zones to be identified intuitively, accelerating decision-making.
- Traceability and audit: all data is recorded and retrievable for regulatory compliance.
Software Applications in the Nuclear and Energy Sector
This type of platform has direct applications in:
- Real-time monitoring in nuclear plants to guarantee operational safety.
- Environmental inspection around industrial facilities to verify compliance with public safety standards.
- Research and development in new facilities or processes requiring radiation assessment.
- Facility decommissioning where precise radiological characterisation is essential.
Technologies Used
Project developed with: Artificial Intelligence — Data Analysis — IoT — Industrial sensors
Does Your Sector Need Specialised Data Analysis Software?
Maedcore develops bespoke data analysis and visualisation solutions for sectors with high precision and regulatory requirements. Request a consultation and we will assess how we can digitalise and automate your inspection or measurement processes.
Request Data Analysis Consultation | View Data Analysis Projects | Data Analysis Services
Ready to transform your company?
Book a free 30-minute meeting with an engineer.