Predictive vs. Preventive Maintenance: Cost and ROI Comparison for Industry
Predictive maintenance vs. preventive maintenance: a data-driven cost, ROI, and implementation comparison for manufacturers deciding between strategies.

Written by Eduardo Fuentevilla Blanco
Robotics Engineer at Maedcore · Robotics Engineer LinkedIn ↗

Key Takeaways
- ► Predictive maintenance reduces unplanned downtime by ~30% vs. the ~10% typical of preventive schedules.
- ► ROI for predictive systems is typically achieved in 12–18 months for mid-size production lines.
- ► Preventive maintenance remains optimal for low-cost, fast-to-replace components — use predictive for high-value assets.
- ► A hybrid strategy (predictive for critical assets, preventive for standard) delivers the best overall cost-benefit ratio.
The Core Question
Every plant manager faces the same decision: how much maintenance is too much — and how little is too risky?
Preventive maintenance answers with a calendar: service every X hours regardless of actual machine condition. Predictive maintenance answers with data: intervene when sensors say it’s necessary.
Both strategies work. The question is which delivers better ROI for your specific assets, budget, and downtime tolerance.
How Each Strategy Works
Preventive Maintenance
Preventive maintenance follows a fixed schedule — daily checks, weekly lubrication, monthly filter replacements, annual overhauls — derived from manufacturer recommendations and historical failure rates.
Advantages:
- Simple to plan and budget
- No sensor infrastructure required
- Works across any equipment type
- Predictable maintenance windows that don’t disrupt production
Disadvantages:
- Over-servicing: replacing components with ~40% useful life remaining
- Under-servicing: catastrophic failures still occur between service intervals
- High labor cost from scheduled interventions regardless of actual need
Predictive Maintenance
Predictive maintenance uses IoT sensors to continuously monitor machine health indicators — vibration, temperature, pressure, energy consumption, acoustic emissions — and feeds data to machine learning models that detect anomalies 2–8 weeks before they become failures.
Advantages:
- Intervenes only when data confirms a real risk
- Extends component life by ~20%
- Reduces unplanned downtime by ~30%
- Provides a full audit trail of asset health history
Disadvantages:
- Requires upfront sensor and connectivity investment
- Needs a data collection period (4–12 weeks) before ML models become accurate
- Requires trained staff to interpret and act on alerts
Cost Comparison
| Cost Category | Preventive | Predictive |
|---|---|---|
| Implementation | Low (scheduling software) | Medium–High (sensors, connectivity, platform) |
| Labor | High (fixed schedule regardless of need) | Low (intervene only when flagged) |
| Parts consumption | High (early replacement of usable components) | Low (replace at true end of useful life) |
| Unplanned downtime | Medium (failures occur between intervals) | Very Low (~30% reduction) |
| 3-year total cost (mid-size plant) | Baseline | ~10% lower |
ROI Analysis: When Does Predictive Pay Off?
The breakeven point depends on two variables: the cost of unplanned downtime and the replacement value of the monitored asset.
Rule of Thumb
Predictive maintenance justifies its investment when:
- Unplanned downtime costs >€500 per hour per production line
- The monitored asset costs >€50,000 to repair or replace
- The asset runs >16 hours per day in continuous production
For a typical automotive stamping line operating 20 hours per day, a single avoided breakdown can save €15,000–€80,000 in lost production and emergency repair costs — paying back an entire sensor deployment in one event.
Typical ROI Timeline
| Phase | Timeline |
|---|---|
| Sensor installation and connectivity | Weeks 1–6 |
| Data collection and model training | Weeks 6–14 |
| First actionable failure predictions | Month 3–4 |
| Positive ROI achieved | Month 12–18 |
Which Strategy for Each Asset Type?
Not all equipment warrants predictive monitoring. A practical decision framework:
| Asset Type | Recommended Strategy | Reason |
|---|---|---|
| CNC machining centers, stamping presses | Predictive | High downtime cost, complex failure modes |
| Electric motors >15 kW | Predictive | Vibration signature predicts bearing failure 4–8 weeks out |
| Conveyor belt systems | Hybrid | Predictive for drive motors, preventive for belt replacement |
| Pneumatic cylinders | Preventive | Sensor cost exceeds repair cost for most failures |
| HVAC and cooling systems | Predictive | Energy savings alone often justify monitoring |
| Small pumps, light fixtures | Preventive/Reactive | Run to failure — replacement is faster than monitoring ROI |
The Hybrid Strategy: Best of Both Worlds
Most plants with >€5M in production equipment use a hybrid maintenance strategy organized in three tiers:
Tier 1 — Predictive: Assets where downtime costs >€1,000/hour or replacement value >€30,000. Full IoT sensor arrays with ML-based alert thresholds.
Tier 2 — Preventive: Standard equipment with defined service intervals. Schedules are optimized using operating-hour data from Tier 1 monitoring infrastructure.
Tier 3 — Reactive: Low-cost components where replacement is faster and cheaper than monitoring. Run to failure and stock spares.
Implementation Path
A predictive maintenance rollout does not require a full-plant deployment on day one:
Phase 1 — Pilot (Weeks 1–6) Select 3–5 critical assets. Install vibration and temperature sensors. Connect to a cloud dashboard. Establish baseline behavior.
Phase 2 — Model Training (Weeks 6–14) Collect data across normal and abnormal operating conditions. Train ML models on historical failure data. Set alert thresholds with the maintenance team.
Phase 3 — Full Deployment (Months 4–12) Roll out to remaining Tier 1 assets. Integrate alerts with the existing CMMS work order system. Train technicians on dashboard interpretation and alert response procedures.
Phase 4 — Continuous Optimization (Ongoing) Every real failure event feeds back into model training, improving accuracy. Expand to Tier 2 assets where pilot ROI data confirms the business case.
Maedcore’s Approach
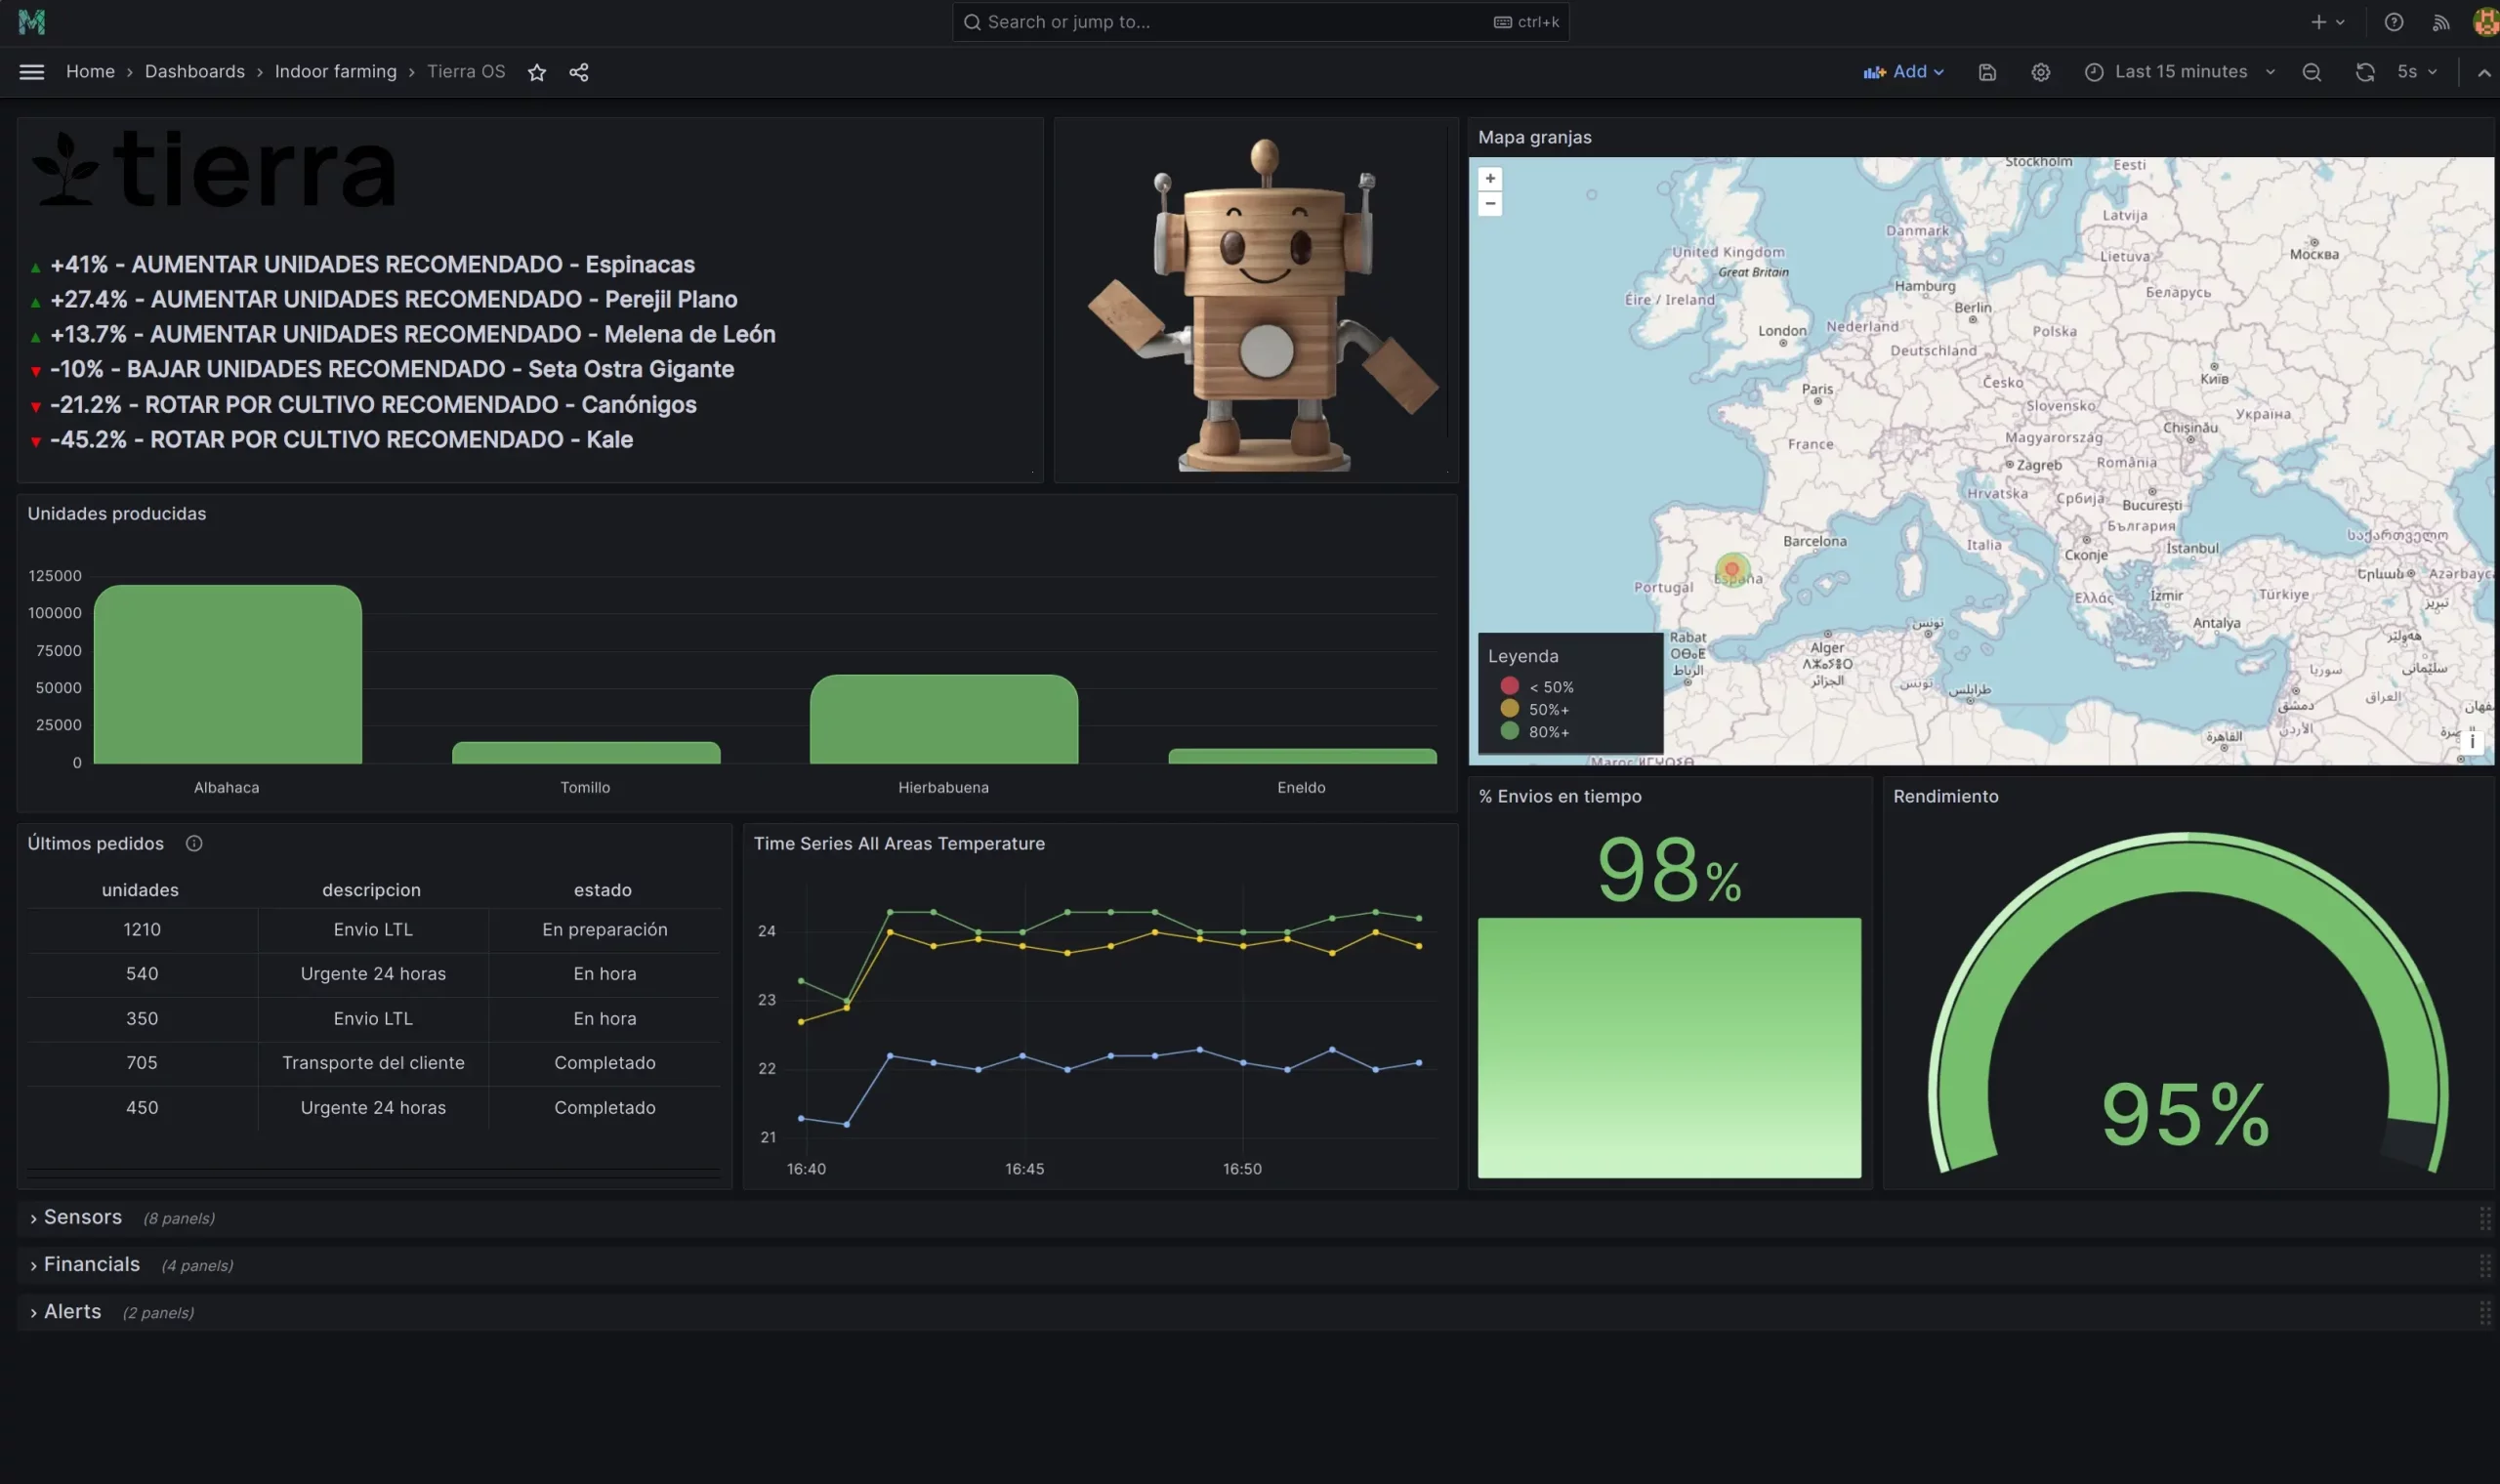
Maedcore implements predictive maintenance systems using the Mapper platform — an IoT monitoring solution that connects existing machine sensors to a cloud analytics dashboard with ML-powered anomaly detection.
Typical deployments cover 10–50 assets in a single plant, with full dashboard visibility in 4–6 weeks and actionable ML predictions within 3 months.
Explore AI & Predictive Maintenance Services →
Related Work
For a real data-and-AI deployment in a regulated industrial environment, see our radiation inspection software for Enusa.
New to the topic? Start with our foundational guide: predictive maintenance with AI — how it works and how to implement it.
About the Author
Robotics Engineer
For over a decade, I have been driven by a single mission: leveraging AI and robotics to build a world of automated production. I believe that by creating self-sufficient systems, we can empower people to refocus on what truly matters—their families and their passions. My expertise spans from winning prestigious European startup competitions to architecting complex, integrated hardware and software projects. I specialize in bridging the gap between today's industrial challenges and tomorrow's autonomous solutions.
Frequently Asked Questions
What is the main difference between predictive and preventive maintenance?
Which maintenance strategy costs less in the long run?
When is preventive maintenance still the better choice?
Can a factory run both predictive and preventive maintenance?
What ROI should I expect from predictive maintenance?
Ready to transform your company?
Book a free 30-minute meeting with an engineer.