Industrial machinery maintenance: why the bottleneck is no longer inspection but post-processing
The real cost of industrial maintenance isn't the inspection visit — it's manual post-processing. Learn to calculate your hidden cost and how to eliminate

Written by Eduardo Fuentevilla Blanco
Robotics Engineer at Maedcore · Robotics Engineer LinkedIn ↗
Key Takeaways
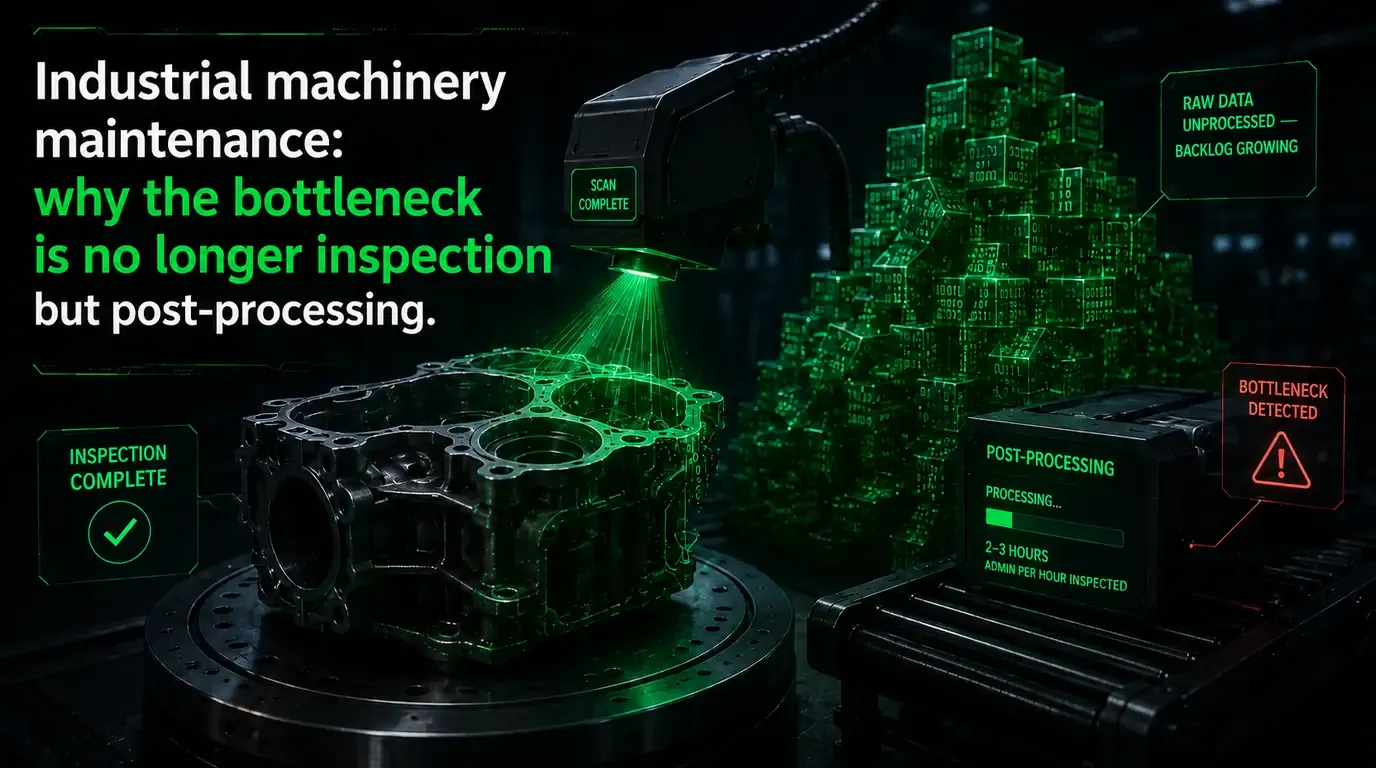
- ► For every hour of field data collection, the manual workflow generates 2–3 additional hours of administrative work, with entry error rates of 1–5% (ANSI, 2026).
- ► 35–45% of manual inspection findings never become work orders — they are lost between the clipboard and the CMMS (Oxmaint, 2026; industry estimate).
- ► For a plant with 50 assets inspected quarterly, the annual addressable cost of manual post-processing is ~€63,000 in administration, rework and avoidable downtime — before counting audit risk.
- ► A peer-reviewed study (arXiv, 2023) found that automated inspection reduces total inspection-plus-report time by 3×, from 3 hours to 1 hour.
- ► Predictive maintenance delivers 5–10% cost reduction and 10–20% availability improvement in mature programmes (Deloitte/DOE); the McKinsey 30–50% range is the ceiling, not the starting point.
- ► Only 28% of SMEs use sector-specific software (INE/ONTSI, 2024), indicating that the majority of the industrial base still operates with manual data workflows in maintenance.
The hidden cost of industrial machinery maintenance isn’t the technician’s site visit — it’s everything that happens afterwards. Compiling reports, transcribing measurements and pushing findings into the CMMS consumes 2–3 hours of administrative work for every hour of field data collection, with manual entry error rates of 1–5% and up to 35–45% of findings that never become work orders. Globally, 55.5% of industrial organisations lose more than $10,000 per hour of unplanned downtime. The question most plants never ask is how much of that cost is a direct consequence of a broken data pipeline between the clipboard and the asset record.
The real cost of industrial machinery maintenance isn’t where you think it is
The visible costs of industrial maintenance are technicians, spare parts and downtime. The invisible cost is the hours that evaporate between the last measurement taken on the plant floor and the moment that information updates the asset history.
Siemens’ True Cost of Downtime 2024 puts unplanned downtime at $1.4 trillion annually across the world’s 500 largest companies. But that figure applies only to the global corporate apex. For a mid-sized industrial plant, the Industrial Downtime Diagnosis 2026 by Fracttal — drawn from more than 2,000 maintenance professionals across 10 countries — is operationally more relevant: 61% of organisations experience downtime on critical assets at least once a month, 22% several times a week, and 55.5% lose more than $10,000 per hour of downtime. Only 20% of organisations actually know the real economic cost of a stoppage when it occurs.
What is almost entirely absent from the available literature is any analysis of the data pipeline after the technician leaves the plant: how much time it consumes, how many errors it introduces, how many findings are lost along the way, and what all of that costs in concrete, calculable terms.
What manual post-processing actually costs: hours, errors and audit risk
For every hour a technician spends collecting data in the field, the manual workflow generates 2–3 additional hours of administrative work, reduces team productivity by 25–35%, and introduces manual entry error rates of 1–5%.
Those figures come from an ANSI field operations analysis (2026) that quantifies the hidden cost of manual compliance tracking. Salesforce documents that administrative tasks consume 30% of the average field technician’s working day — slightly more than the 29% spent actually delivering the service.
The problem compounds at the CMMS handoff stage. An industrial facilities analysis published by Oxmaint (2026) — best cited as an industry estimate rather than a controlled study, given its vendor-adjacent origin — found that 35–45% of manual inspection findings never become work orders: they get trapped somewhere between the clipboard and the system. TradeBeyond (2026) additionally documents that inspectors lose consistency after approximately two hours of repetitive work, with defect detection rates falling 20–40% by end of shift.
Regulatory risk adds another layer that is rarely quantified. Industrial plants in regulated sectors operate under documented inspection obligations tied to pressure equipment regulations, lifting machinery standards and high-voltage electrical installations. In our experience on industrial inspection projects, recovering historical documentation for a regulatory audit from a manual system can consume an entire weekend of work — with a real risk of not finding what you need.
Manual vs. automated workflow: the six steps of the data lifecycle
| Step | Manual workflow | Cloud/automated workflow | Time delta | Error risk |
|---|---|---|---|---|
| 1. Field capture | Paper checklist + photos on personal phone | Structured digital form + auto-geotagged photos | ~0 min | High (illegible notes, skipped fields) |
| 2. Data transfer | Technician returns to office; emails photos; types up notes | Data synced to cloud on leaving site (or next WiFi) | –45 to 90 min/visit | Medium (wrong attachments, version confusion) |
| 3. Report compilation | Admin/technician manually assembles PDF: copies measurements, inserts photos, formats tables | Report auto-generated from structured data; 3D map auto-populated | –2 to 4 h/asset | High (transcription errors 1–5%) |
| 4. Double-check | Second reviewer checks report before sending | Automatic validation: mandatory fields block submission until complete | –30 to 60 min/report | Eliminated |
| 5. CMMS entry and work order creation | Manual re-entry of findings into CMMS; 35–45% never become work orders | Direct API push to CMMS; work order auto-created when threshold exceeded | –30 to 60 min/asset | Critical (35–45% finding loss) |
| 6. Audit retrieval | Search through physical files or email; a “weekend project” | Instant query by asset, date, technician or finding type | –hours per audit | Regulatory non-compliance risk |
The data lifecycle audit framework: how to calculate your real industrial machinery maintenance cost
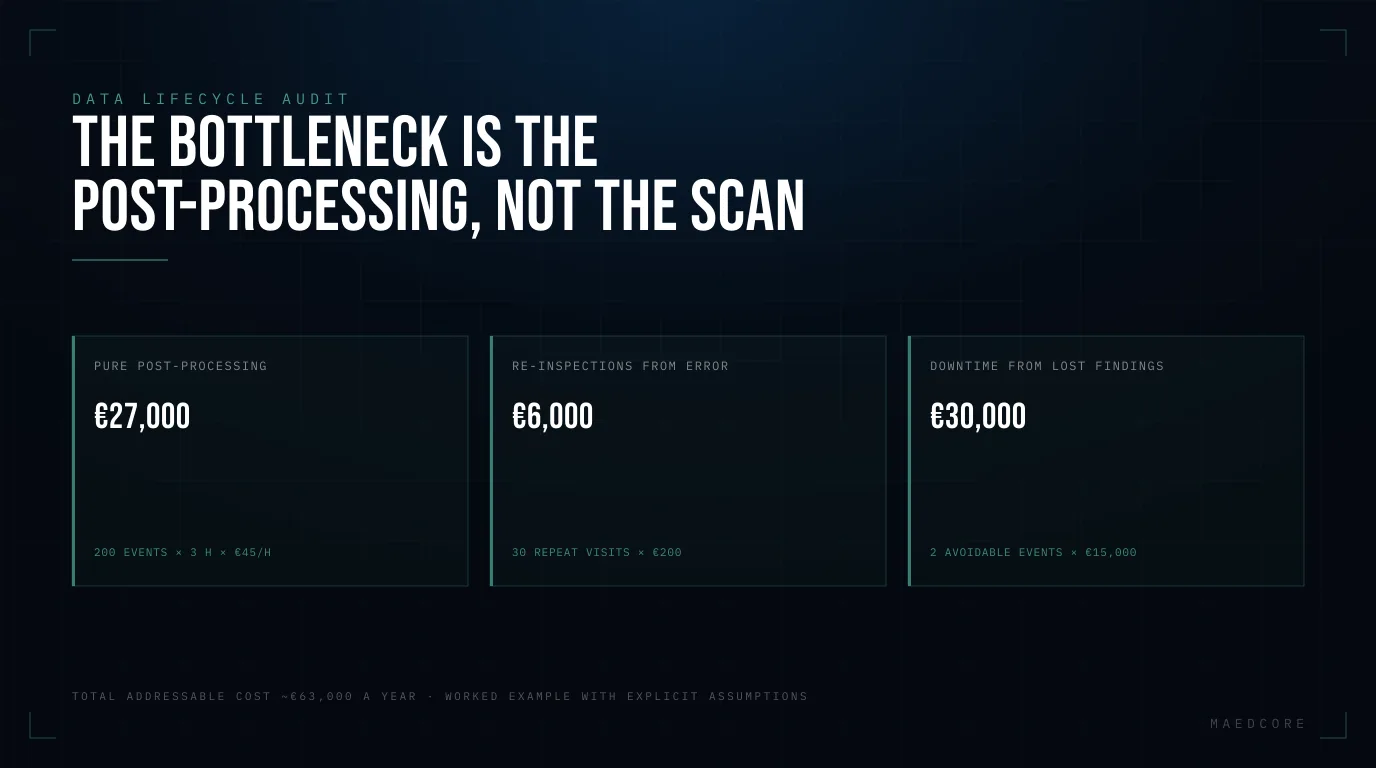
Mapping the complete lifecycle of a single inspection event reveals that the real cost sits not in the site visit but in steps 2–5: transfer, compilation, double-check and CMMS entry. This is the framework that allows a maintenance manager to calculate their own hidden cost using their own data.
Before reading the worked example, apply the logic to your last 10 inspections. For each one, estimate how much time steps 2–5 consumed. Multiply by your fully loaded technician rate. That is your real post-processing cost — the one that appears in no budget line.
A peer-reviewed preprint published on arXiv (2023) compared manual inspection with AI-assisted automated inspection in construction: the manual team took 3 hours in total (including 30 minutes of report writing), while the automated system completed both the inspection and report generation in a single hour — a 3× reduction in total time. This is the only direct before/after comparison available in peer-reviewed literature for this specific workflow.
Worked example with explicit assumptions
The following numbers are engineering estimates, not guarantees. The assumptions are stated so you can substitute your own plant’s figures.
Starting assumptions:
- Plant with 50 inspectable assets (process machinery, pressure equipment, lifting systems)
- Inspection frequency: quarterly = 200 inspection events per year
- Manual post-processing per event: 3 hours (transfer + report + CMMS entry) — consistent with the ANSI 2–3 h/field hour range and the arXiv study’s 3-hour figure
- Fully loaded technician rate: €45/hour (engineering judgment for Western Europe; realistic range €35–55/h depending on sector and collective agreement)
- Re-inspection rate due to error: 15% of events (engineering judgment, consistent with the cumulative 1–5% error rate across steps 2–5)
- Cost per re-inspection visit: €200 (travel + minimum on-site time)
- Findings lost that escalate to unplanned failure: 2 events/year (conservative assumption)
- Cost of avoidable unplanned downtime: €15,000/event (lower bound of the Fracttal range for organisations losing >$10,000/hour)
Calculation:
| Item | Calculation | Annual cost |
|---|---|---|
| Pure post-processing hours | 200 events × 3 h × €45/h | €27,000 |
| Re-inspections due to error | 200 × 15% = 30 visits × €200 | €6,000 |
| Avoidable downtime from lost findings | 2 events × €15,000 | €30,000 |
| Total addressable cost | ~€63,000/year |
This €63,000 annual cost appears on no maintenance budget line. It is the cost of data pipeline inefficiency after the inspection, before counting regulatory audit risk. The global inspection management software market reached $9.2 billion in 2024 and is projected to reach $18.86 billion by 2030 at a 13.2% CAGR (Grand View Research) — a reflection of the fact that thousands of plants are doing exactly this calculation.
Self-diagnosis prompt: Take your last 10 inspections. Add up the real time spent on steps 2–5 per asset. Multiply by your fully loaded rate. If the result exceeds €15,000 annually for your asset base, you have a business case for automating post-processing — regardless of which platform you choose.
Predictive maintenance: why data quality matters more than the strategy you choose
The shift from reactive to predictive maintenance fails more often because of data pipeline quality than because of strategy selection — a predictive programme fed by incomplete manual data produces worse predictions than a well-executed preventive programme with clean data.
ROI figures vary widely by source. McKinsey documents 18–25% reductions in maintenance costs and 30–50% reductions in unplanned downtime, but those figures describe mature programmes with well-tuned models. The US Department of Energy and Deloitte offer more conservative and more CFO-defensible ranges: 5–10% reduction in maintenance costs and 10–20% improvement in availability. Use the McKinsey range as the ceiling for a mature programme, and the Deloitte/DOE range as the realistic promise for year one. 27% of organisations recover their investment in under 12 months (IoT Analytics, 2023).
The point that reference articles on predictive maintenance systematically ignore is this: prediction quality depends on inspection history quality. A machine learning model trained on data where 40% of findings were never recorded, where measurements carry a 1–5% error rate, and where reports live in unstructured PDFs cannot produce reliable predictions. Post-processing automation is not an administrative efficiency project — it is the technical prerequisite for any predictive maintenance ambition.
How to evaluate a cloud inspection platform for industrial machinery maintenance
The right platform depends on each plant’s specific context, but certain selection criteria apply universally.
In 2024, 53% of new inspection software deployments were cloud-native, confirming that cloud is now the default for new implementations. Available platforms fall into three families:
- Digital checklist platforms (GoAudits, SafetyCulture/iAuditor): Customers report inspections up to 5× faster than with paper. Strong on checklist automation and corrective action workflows; no 3D spatial mapping.
- CMMS with inspection module (Limble, Tractian, Fracttal One): Strong on work order management and integration with predictive analytics; weaker on the spatial/3D reporting layer.
- Inspection platforms with 3D maps: The critical functional differentiator. A flat PDF report documents a point-in-time finding; a spatially indexed 3D map lets you see whether a crack has grown between Q1 and Q3, and delivers that context to a technician who has never visited the asset.
In an inspection project we built for ENUSA Industrias Avanzadas, automating the processing of radiation inspection data eliminated manual re-entry and reduced the time between data capture and decision-ready availability — exactly step 2 in the table above.
Non-negotiable selection criteria
1. Is the form structured or free-form? A fillable PDF is a digital dead end. Ask the vendor: can a measurement taken today be queried in a trend chart six months from now without manual intervention?
2. Does it work offline? Industrial plants have areas with poor connectivity. A platform requiring constant connectivity creates a new bottleneck. Demand offline capability with automatic sync on reconnection.
3. Does it integrate with your existing CMMS? Integration barriers with brownfield equipment are the primary reason pilots stall: 50–60% of industrial companies cite integration with legacy systems as the biggest obstacle (ARC Advisory Group, 2024). Budget a data-mapping phase before selecting a platform.
4. Does it generate immutable audit trails? In regulated industrial environments, documentary traceability is non-negotiable. The platform must generate a record of who inspected, when, what measurement was taken and what action was triggered — with a timestamp that cannot be edited retroactively.
Most common implementation mistakes
Digitising the form, not the workflow. Moving a paper checklist to a tablet PDF produces a cleaner document but remains a dead end. The value lies in structured data flowing automatically into the asset record.
Over-scoping the pilot. Monitoring the 10% of assets that generate 80% of downtime risk delivers ROI in 6–12 months. Starting with a full asset register rollout slows adoption and dilutes the business case.
Treating the report as the end product. The report is an intermediate artefact. The end product is the updated asset health record and the generated work order. Organisations that measure success by “reports generated” rather than “defects actioned” will not realise the ROI.
The operational digitalisation gap in industrial manufacturing
Only 28% of SMEs use sector-specific software, and while 49% of mid-sized companies already use cloud services, only 10% of micro-enterprises do (ONTSI, 2024). “Basic digitalisation” — the threshold most SMEs have crossed — means web presence and email, not operational workflow automation.
The industrial maintenance software market reflects this dynamic: the global CMMS market reached $1.29 billion in 2024 and is projected to reach $2.41 billion by 2030 at an 11.1% CAGR (Grand View Research). Growth is concentrated in the mid-sized industrial segment making exactly the transition this article describes.
Conclusion: the bottleneck you can actually eliminate
Optimal inspection frequency and the choice between preventive and predictive maintenance are legitimate conversations. But both assume that inspection data arrives clean, complete and actionable in the management system — and in most industrial plants, that assumption is false.
The cost of that gap is calculable: for a plant with 50 assets inspected quarterly, the conservative estimate is ~€63,000 annually in pure administration, rework and avoidable downtime, before counting regulatory risk. The first step is to run the calculation with your own data: take your last 10 inspections, add up the real time spent on steps 2–5, multiply by your fully loaded technician rate. If you want to see what that automated workflow looks like in a real environment, the inspection project we built for ENUSA illustrates that before-and-after in a regulated industrial inspection context.
Related reading
- Predictive vs. Preventive vs. Corrective Maintenance — the cost and ROI comparison that decides which strategy fits which asset.
- Prescriptive Maintenance — the step past prediction: from sensor reading to an actual work order.
- Predictive Maintenance with AI — the sensor-and-model side: what IoT data and machine learning actually contribute.
- Automated Visual Inspection — what accuracy is realistic, and the three gates a vision system has to clear first.
- Digital Work Orders — closing the loop: how the job gets assigned, executed and traced without paper.
- Maedcore, Mapper: Inspection Software with Automatic Reports and 3D Maps — Maedcore, success story
- Maedcore, Radiation Inspection Software for ENUSA Industrias — Maedcore, success story
- Maedcore — Digital Solutions — what we build in this area.
Sources
- Siemens, The True Cost of Downtime 2024 — Siemens / InfoPLC, 2024
- Fracttal, Industrial Downtime Diagnosis 2026 — Interempresas / Fracttal, 2026
- Grand View Research, Inspection Management Software Market Report 2030 — Grand View Research, 2024
- Grand View Research, CMMS Market Report 2030 — Grand View Research, 2024
- ANSI Blog, The Hidden Cost of Manual Compliance Tracking in Field Operations — ANSI, 2026
- Oxmaint, How Quadruped Robots Reduce Manual Inspection Costs by 60%: 2026 Case Study — Oxmaint, 2026 (industry estimate; vendor-adjacent origin)
- arXiv, AutoRepo: A General Framework for Multi-Modal LLM-Based Automated Construction Reporting — peer-reviewed preprint, 2023
- TradeBeyond, The Hidden Costs of Manual Inspections in Supply Chain Quality Control — TradeBeyond, 2026
- Reliamag, Predictive Maintenance ROI Benchmarks: What the Studies Show — Reliamag, 2026
- ONTSI, SME Digitalisation Report 2024 — Ministry for Digital Transformation, 2024
- 10Code / desarrollosoftware.es, SME Digitalisation in Spain 2026 — citing INE, Eurostat, ONTSI, 2026
- Market Research Future, Industrial Maintenance Management Software Market — MRFR, 2026
- Floodlight Software, The Real Cost of Staying Manual — citing Salesforce Field Service Benchmark, 2026
- Maedcore, Mapper: Inspection Software with Automatic Reports and 3D Maps — Maedcore, success story
- Maedcore, Radiation Inspection Software for ENUSA Industrias — Maedcore, success story
About the Author
Robotics Engineer
For over a decade, I have been driven by a single mission: leveraging AI and robotics to build a world of automated production. I believe that by creating self-sufficient systems, we can empower people to refocus on what truly matters—their families and their passions. My expertise spans from winning prestigious European startup competitions to architecting complex, integrated hardware and software projects. I specialize in bridging the gap between today's industrial challenges and tomorrow's autonomous solutions.
Frequently Asked Questions
What does an hour of unplanned downtime cost at an industrial plant?
What is the difference between digitising a checklist and automating the inspection workflow?
What ROI can I realistically expect from implementing predictive maintenance?
What technical criteria should I require from a cloud inspection platform before buying?
How do I know whether manual post-processing is really a problem at my plant?
Ready to transform your company?
Book a free 30-minute meeting with an engineer.