Automated Visual Inspection: What Accuracy Can You Realistically Expect?
Academic benchmarks, camera and lighting specs, and a 3-gate decision framework for knowing when to automate visual inspection — and when not to.

Written by Eduardo Fuentevilla Blanco
Robotics Engineer at Maedcore · Robotics Engineer LinkedIn ↗
Key Takeaways
- ► Human inspectors miss 20–30% of defects in real production; inter-inspector agreement on defect severity is only 55–70%.
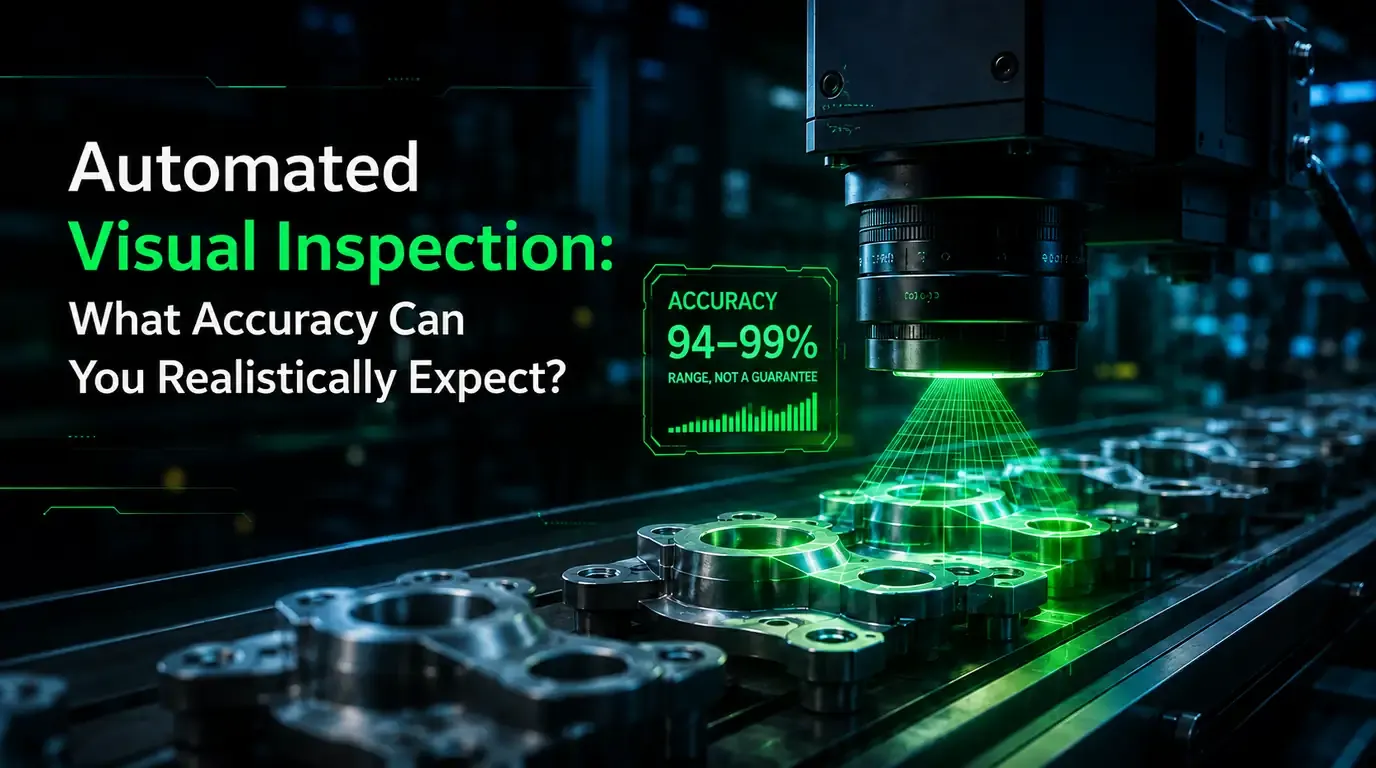
- ► The best academic models on MVTec AD achieve 94.8% accuracy and 91.7% mAP; vendor claims of 99%+ are attainable under controlled conditions but degrade with batch variability or lighting changes.
- ► Lighting determines 70% of AVI system success — a lighting audit before selecting any camera or algorithm delivers the highest return on engineering time.
- ► Payback ranges from 5 to 24 months depending on sector; the most sensitive variable is cost per escaped defect, which can range from €5 (cosmetic) to €250,000 (safety-critical component).
- ► 77% of AI pilots in manufacturing never make it past the prototype phase; the most common cause is skipping labelled data collection and system qualification.
- ► The three-gate framework (technical feasibility → economic feasibility → organisational readiness) lets you rule out non-viable projects before committing budget.
Automated visual inspection (AVI) combines industrial cameras, controlled lighting, and vision software — classical or AI-based — to detect defects at speeds and consistency levels the human eye simply cannot sustain. The number that anchors the business case: a human inspector misses between 20 and 30% of defects under real production conditions, and accuracy drops a further 15–25% after two hours of continuous observation (RoboticsTomorrow, 2025). The best AI-based AVI systems achieve between 94 and 99% accuracy — but that range hides critical differences depending on defect type, surface finish, and input image quality. This article breaks down what accuracy you can realistically expect, which camera and lighting specifications make it possible, and a three-gate decision framework for determining whether a project makes economic sense before committing budget.
What Is Automated Visual Inspection and Why Does It Matter Now?
AVI is not new, but the combination of high-resolution sensors, stable LED lighting, and deep learning models has radically expanded its scope. It is now technically viable in sectors that, five years ago, depended entirely on human judgment.
Inter-inspector agreement on defect severity sits at just 55 to 70% (iFactory, 2026): two different inspectors — or the same inspector on two different shifts — can reach opposite verdicts on the same part. That variability has a direct price tag: according to the American Society for Quality, the Cost of Poor Quality (COPQ) can represent 15 to 20% of total revenue at a manufacturing company (RoboticsTomorrow, 2025). AVI is one of the most thoroughly documented ROI use cases within the Industry 4.0 umbrella.
Real-World Accuracy: What Academic Benchmarks Say (and What Vendors Leave Out)
AVI systems achieve 95 to 99% detection accuracy according to vendor sources — but academic benchmarks tell a more nuanced, and more useful, story for anyone making a purchasing decision.
Academic Benchmarks vs. Commercial Claims
The MVTec AD dataset is the reference standard for industrial anomaly detection. A deep learning framework published in 2025 (M2U-InspectNet, based on multi-scale vision transformers and self-supervised contrastive pre-training) achieved 94.8% accuracy and 91.7% mAP at 52 FPS on edge devices (ResearchGate, 2025). A two-stage approach (autoencoder + CNN) published in PMC the same year achieved an IoU of 89.60% for detection and 86.82% accuracy for classification (PMC, 2025).
MVTec AD 2 (published March 2025), designed specifically to expose the limitations of current methods, introduces eight industrial scenarios with images ranging from 2.6 to 5 MP. Its headline finding is uncomfortable for vendors: differences in segmentation scores between models are frequently less than 1 percentage point, and some categories — such as reflective metal cans — remain “extremely challenging” (Emergent Mind / MVTec, 2025).
Commercial claims of “99.7% accuracy from week one” are not necessarily dishonest about the system under controlled conditions — they simply omit that this figure degrades in real production when lighting varies, surface finish changes between batches, or the model has not seen enough examples of a rare defect type.
Deep Learning vs. Classical Vision: When Each Wins
Classical methods based on statistical filters can achieve detection rates of up to 90% for structured, well-lit, low-variance defects, but they are brittle in the face of variability (PMC, 2025). Deep learning wins on unstructured, variable, or subtle defects — but it demands labelled datasets of sufficient size.
| Criterion | Classical Vision (CV) | Deep Learning (DL) |
|---|---|---|
| Ideal defect type | Geometric, dimensional, sharp edges | Texture, anomaly, subtle or variable defect |
| Minimum dataset | No training needed (explicit rules) | ≥ 200 images per defect class |
| Accuracy ceiling | ~90% under stable conditions | 94–99% with sufficient data |
| Computational cost | Low (CPU, FPGA) | Medium–high (GPU, edge AI) |
| Retraining on change | Manual rule reprogramming | Model fine-tuning (weeks) |
| Fragility to variability | High (sensitive to batch changes) | Medium (improves with more data) |
In practice, the most robust systems combine both approaches: classical vision for precise dimensional measurement, deep learning for complex defect classification. Treating them as competitors is the first design mistake.
The Regulated Standard: The Knapp Test
In regulated sectors such as pharmaceuticals, qualifying an AVI system requires passing a Knapp test: demonstrating that the machine’s accuracy is equal to or better than that of a trained, qualified human inspector (Dabrico, 2026). It is the criterion any quality manager should demand, regulated or not. Production targets point to fewer than 2% false rejects while maintaining a real defect detection rate of 98% or above (Averroes AI, 2026). When the false-positive rate exceeds 3%, operators begin systematically overriding the system — and the project fails not because of the algorithm, but because of the operating model.
Camera and Lighting Specifications: The Maths Nobody Publishes
Lighting determines 70% of the success of an automated visual inspection system — more than the camera, more than the algorithm. Choosing the sensor first and thinking about light afterwards is the most common and most costly mistake.
The Resolution Formula You Need Before Buying Anything
Before selecting any component, calculate the minimum required resolution:
Required resolution (px) = (Field of view, mm) / (Minimum defect size, mm) × 5Concrete example: field of view 200 mm, minimum defect 0.2 mm → 200 / 0.2 × 5 = 5,000 px → 25 MP sensor. At a line speed of 1 m/s with a 200 mm field, the minimum frame rate is 1,000 / 200 × 5 = 25 fps minimum. If the sensor does not satisfy both requirements simultaneously, no algorithm will compensate.
Lighting Selection by Defect Type
| Defect type | Recommended lighting technique | Why it works |
|---|---|---|
| Surface scratches | Dark-field | Highlights lateral light scattering at the discontinuity |
| Reflective / mirror-finish surfaces | Coaxial | Eliminates specular reflections that mask the defect |
| Silhouette and edge measurement | Backlighting | Maximum contrast between part and background |
| Matte surfaces with relief | Diffuse | Suppresses shadows that generate false positives |
| 3D defects or complex geometry | Structured light / fringe projection | Enables point-cloud reconstruction |
A real failure mode: a system failed every day at 2 p.m. because sunlight entered through a skylight at the exact angle to blind the camera. Industrial AVI stations require rigorously controlled light environments — this is not optional. Another source of silent degradation: LED arrays lose intensity over their service life (20,000–50,000 hours); the reference grey level drifts, the false-positive rate rises gradually, and nobody connects it to the hardware. Monthly photometric calibration is preventive maintenance, not a luxury.
The M2U-InspectNet benchmark (52 FPS at 94.8% accuracy on edge devices) confirms that cloud inference is unnecessary for most line speeds (ResearchGate, 2025). Edge processing reduces reject-signal latency — a critical factor when a part is travelling at 1 m/s and the ejector is 300 mm downstream of the camera.
Three-Gate Decision Framework: Should You Automate This Inspection?
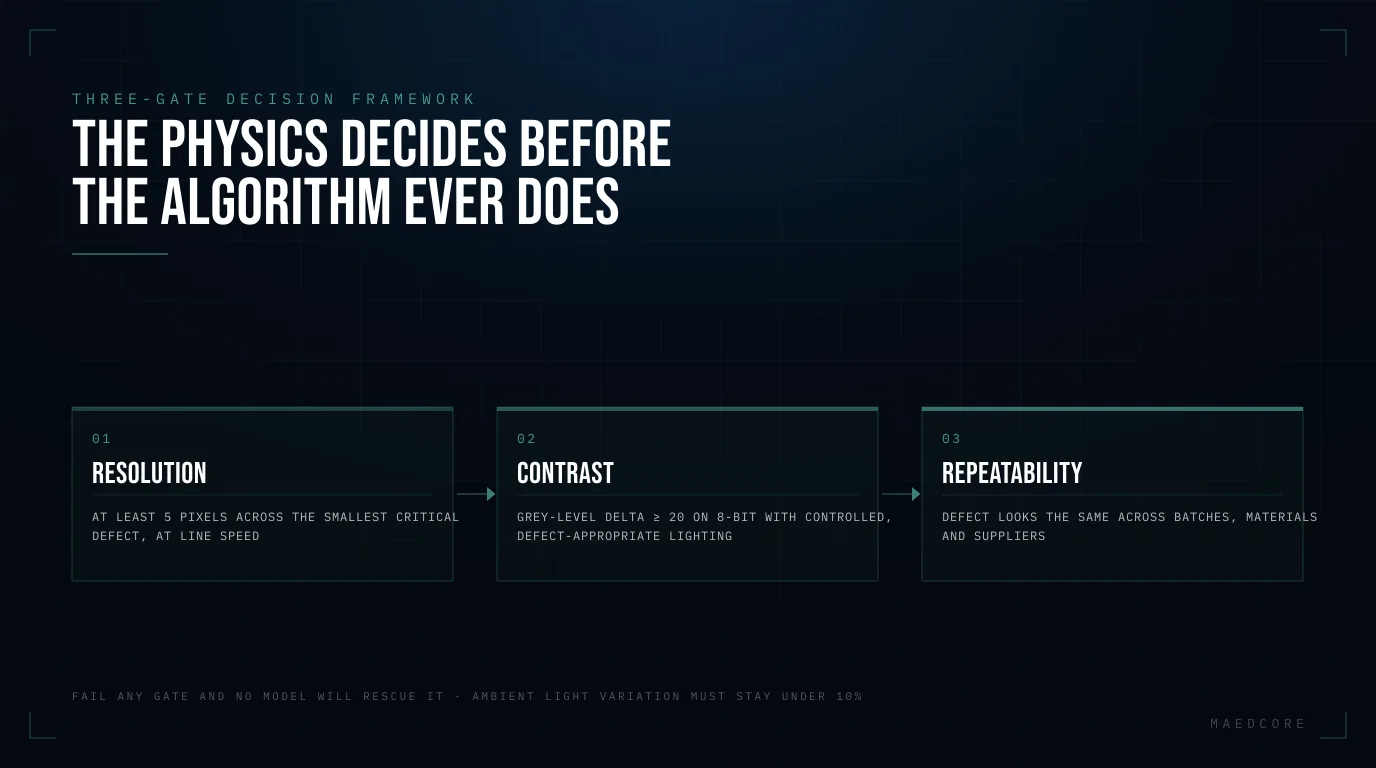
No existing online resource offers a structured framework that combines technical feasibility, economic feasibility, and organisational readiness in a single tool. The three gates are sequential: failing any one of them is reason enough not to proceed yet.
Gate 1 — Technical Feasibility: Can a Camera See It?
| Criterion | Pass threshold | Diagnostic question |
|---|---|---|
| Defect-to-pixel ratio | ≥ 5 pixels on the smallest critical defect | Does resolution × frame rate resolve the defect at line speed? |
| Achievable contrast | ΔGray ≥ 20 (8-bit) with controlled lighting | Can lighting isolate the defect from the background? |
| Defect consistency | Repeatable appearance across batches | Does the defect change with material batch, temperature, or operator? |
| Part geometry | Flat, cylindrical, or 3D-scannable | Does it require multi-camera or 3D reconstruction? |
| Environment controllability | Ambient light variation < 10% | Can the station be enclosed or shielded? |
Engineering note: On a nuclear fuel cladding inspection project for ENUSA, surface anomalies manifested as subtle grey-level variations — achievable contrast was the binding constraint, not resolution. The lighting audit preceded camera selection by six weeks.
Gate 2 — Economic Feasibility: Do the Numbers Stack Up?
The calculation has four variables with explicit assumptions:
Annual Cost of Escapes (ACE):
ACE = Annual volume × Defect rate × Escape rate × Cost per escaped defect
Annual Cost of False Positives (ACFP):
ACFP = Annual volume × False-positive rate (target < 2%) × Rework cost per unit
Annual System Operating Cost (ASOC):
ASOC = (CapEx amortised over 5 years) + (Annual maintenance ~10% of CapEx) + (Retraining labour)
Decision rule:
If (ACE_before − ACE_after) + Labour savings − ACFP − ASOC > 0 → proceed
Worked example (SME plant, conservative assumptions):
| Parameter | Assumed value |
|---|---|
| Annual production | 500,000 units |
| Current defect rate | 1.5% |
| Escape rate (manual inspection) | 30% |
| Escaped defects per year | 2,250 |
| Cost per escape (return + penalty) | €150 |
| ACE before automation | €337,500/year |
| System CapEx (2D inline AI, mid-range) | €120,000 |
| Amortised CapEx (5 years) | €24,000/year |
| Annual maintenance (10% of CapEx) | €12,000/year |
| 2 inspectors redeployed | €50,000/year |
| Target false-positive rate | 1.5% → 7,500 units |
| Rework cost per unit | €8 |
| ACFP | €60,000/year |
| Net annual benefit | €337,500 + €50,000 − €60,000 − €36,000 = €291,500 |
| Estimated payback | ~5 months |
This result is consistent with the 7–8 month range cited by Forrester (2024) for high-volume deployments (Tensoria, 2026). For lower-volume applications or lower unit defect costs, typical payback sits between 12 and 24 months (AI-Innovate, 2026). The most sensitive variable is the cost per escaped defect: for a cosmetic component it may be €5; for a safety-critical automotive component, recall charges can reach €50,000–€250,000 per incident.
Total implementation cost (hardware + software + integration + training) ranges from €110,000 to €200,000 (SmartDev, 2026). 68% of manufacturers report cost overruns on their first project, primarily from underestimating integration complexity and ongoing operational expenses (SmartDev, 2026).
Gate 3 — Organisational Readiness: Can You Sustain It?
| Criterion | Pass threshold |
|---|---|
| Labelled image archive | ≥ 200 confirmed defect images per class (or a synthetic augmentation plan) |
| Upstream process stability | Cp/Cpk ≥ 1.33 |
| Integration owner | Named engineer with PLC/MES access and authority to modify line control |
| Retraining cadence | Committed quarterly model review with production data |
| Change management | Quality manager buy-in; operators trained in the manual-override protocol |
In an inspection software project we built, the binding constraint was not the algorithm but the absence of a structured image archive. A six-week data-collection sprint preceded model training. 77% of AI pilots in manufacturing never make it past the prototype phase (BuildMVPFast, 2026); most of those failures are concentrated in projects that jump directly from demo to production, skipping data collection and system qualification.
When NOT to Automate Visual Inspection
Every article ranking for this topic is an argument for automation. Here is the honest answer about when manual inspection is still the right call:
- Very low volume, high variety: if you run 50 different part numbers in batches of 200 units, the retraining and qualification cost outweighs the benefit.
- Defects requiring tactile or olfactory judgment: machine vision does not detect internal burrs, insufficient hardness, or chemical contamination without additional sensors.
- Unstable upstream process (Cpk < 1.0): automating inspection without stabilising the process is fitting a smoke detector in a burning room.
- Non-repeatable, rare defect: if the defect occurs fewer than once every 10,000 parts and you have no historical images, building a reliable model can take more than a year of data collection.
Frequently Asked Questions
What accuracy does automated visual inspection actually achieve?
The most recent academic benchmarks on the standard MVTec AD dataset place the best deep learning models at around 94.8% accuracy with an mAP of 91.7% (ResearchGate, 2025). Vendor figures (95–99%) are achievable under controlled conditions with defects well represented in the training dataset, but degrade in real production when batch variability, lighting changes, or new defect types appear. The hardest surface remains reflective metal, where the best models still show inconsistent performance according to MVTec AD 2 (2025).
How much does it cost to implement an automated visual inspection system?
The range runs from around €3,000 for a compact 2D desktop unit to over €200,000 for high-speed 3D inline systems (Averroes AI, 2026). A complete standard deployment — hardware, software, integration, and training — typically falls between €110,000 and €200,000 (SmartDev, 2026). 68% of manufacturers report cost overruns on their first project, primarily from underestimating PLC/MES integration and ongoing operational costs.
How long does it take to recoup the investment?
It depends primarily on the unit cost of an escaped defect. Forrester (2024) cites an average payback of 7–8 months for high-volume deployments in sectors such as automotive and semiconductor (Tensoria, 2026). For lower-risk applications, the typical range is 12–24 months (AI-Innovate, 2026). For safety-critical components where a single escape can generate charges of €50,000–€250,000, payback can be under six months.
How many defect images do I need to train the model?
The practical threshold is ≥ 200 labelled images per defect class for a supervised deep learning model. For rare defects (fewer than one occurrence per 10,000 parts), synthetic augmentation via GANs or unsupervised anomaly-detection approaches are viable alternatives. Skipping this phase is the most common cause of failure: 77% of AI pilots in manufacturing never make it past the prototype phase (BuildMVPFast, 2026).
When is automating visual inspection not worth it?
Automation is not cost-effective when volume is very low with high part-number variety, when the upstream process is unstable (Cpk < 1.0), when the defect occurs fewer than once every 10,000 parts with no historical image archive, or when the required judgment is tactile, olfactory, or contextual. In those cases, stabilising the process or investing in data collection is the necessary first step.
Related reading
- Predictive vs. Preventive vs. Corrective Maintenance — the cost and ROI comparison that decides which strategy fits which asset.
- Prescriptive Maintenance — the step past prediction: from sensor reading to an actual work order.
- Industrial Machinery Maintenance — why the constraint moved from the inspection visit to manual post-processing.
- Predictive Maintenance with AI — the sensor-and-model side: what IoT data and machine learning actually contribute.
- Maedcore — Digital Solutions — what we build in this area.
Sources
- Automatic Visual Inspection for Industrial Application — PMC / MDPI (open access), 2025.
- Deep Learning for Automated Defect Detection in Industrial Manufacturing — ResearchGate (peer-reviewed), 2025.
- MVTec AD Benchmark Summary — Emergent Mind, 2025.
- AI Vision Inspection for Manufacturing Guide — iFactory (vendor), 2026.
- How to Reduce False Positives in AI Visual Inspection — Averroes AI (vendor), 2026.
- Automated Optical Inspection Machine Price — Averroes AI, 2026.
- Computer Vision for Quality Inspection — Tensoria (citing Forrester 2024), 2026.
- Computer Vision Cost Manufacturing — SmartDev, 2026.
- Automated Visual Inspection ROI — AI-Innovate, 2026.
- 2026 Guide to Automated Visual Inspection Systems — Dabrico, 2026.
- AI Quality Control: Computer Vision for Manufacturing 2026 — BuildMVPFast, 2026.
- Automatic Visual Inspection: The Secret to Flawless Manufacturing Quality — RoboticsTomorrow (citing ASQ 2024, HFES 2021), 2025.
About the Author
Robotics Engineer
For over a decade, I have been driven by a single mission: leveraging AI and robotics to build a world of automated production. I believe that by creating self-sufficient systems, we can empower people to refocus on what truly matters—their families and their passions. My expertise spans from winning prestigious European startup competitions to architecting complex, integrated hardware and software projects. I specialize in bridging the gap between today's industrial challenges and tomorrow's autonomous solutions.
Frequently Asked Questions
What accuracy does automated visual inspection actually achieve?
How much does it cost to implement an automated visual inspection system?
How long does it take to recoup the investment in automated visual inspection?
How many defect images do I need to train an automated visual inspection model?
When is automating visual inspection not worth it?
Ready to transform your company?
Book a free 30-minute meeting with an engineer.