Prescriptive Maintenance: What It Does That Predictive Cannot
From sensor to work order: how the full prescriptive maintenance loop works, with a real industrial example and a 5-phase implementation framework.

Written by Eduardo Fuentevilla Blanco
Robotics Engineer at Maedcore · Robotics Engineer LinkedIn ↗
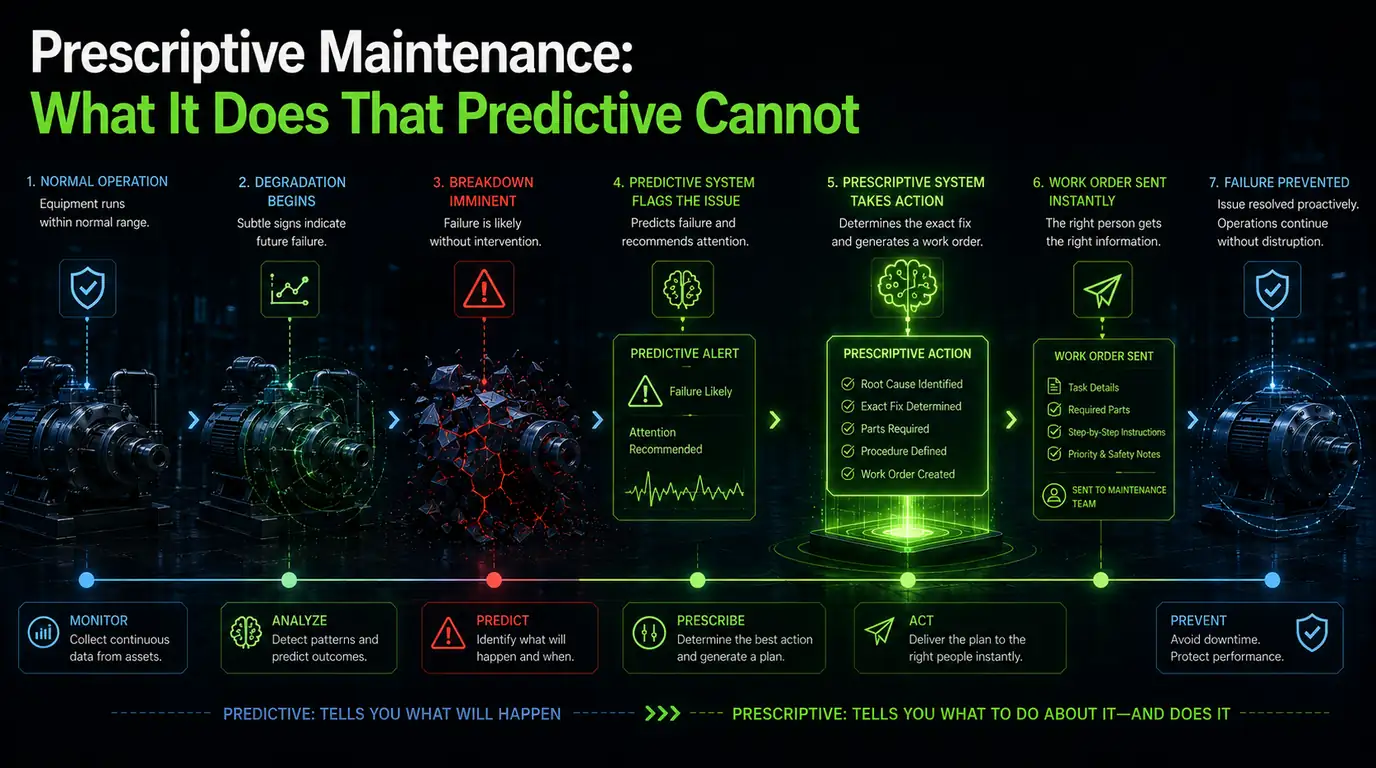
Key Takeaways
- ► Only 6% of industrial organisations currently use prescriptive analytics (Fracttal 2024, n=2,500), versus 27% using predictive — the gap represents a genuine competitive window for early movers.
- ► The key operational difference: predictive opens an alert; prescriptive opens a work order with the part, technician, and intervention window already specified.
- ► 60–70% of initiatives fail to reach their ROI target — the primary causes are poor data quality, incorrect sensor mounting, and organisational resistance, not the AI model (OxMaint, 2025).
- ► The cold-start problem is solved with physics-based anomaly detection (Isolation Forest or Z-score) for the first 6 months, requiring no labelled failure history.
- ► For a brownfield plant with 5 critical assets, total Year 1 cost ranges from €14,100 to €39,900, with potential partial subsidy via Spain's Kit Digital or Activa Industria 4.0 programmes.
- ► The loop only becomes truly prescriptive when every intervention outcome — actual failure mode, parts used, post-repair baseline — feeds back into the model for retraining; without that closure, the system does not improve.
Prescriptive maintenance is the only level of the analytics ladder that does not merely detect an impending failure — it calculates when to intervene, what to do, and which resources you need. Only 6% of industrial organisations currently use prescriptive analytics, according to a survey of 2,500 professionals by Fracttal (2024), while the median cost of an unplanned stoppage exceeds USD 100,000 per hour. The gap between what the technology can do and what industry has actually deployed has never been more profitable to close.
What is prescriptive maintenance, and how does it actually differ from predictive?
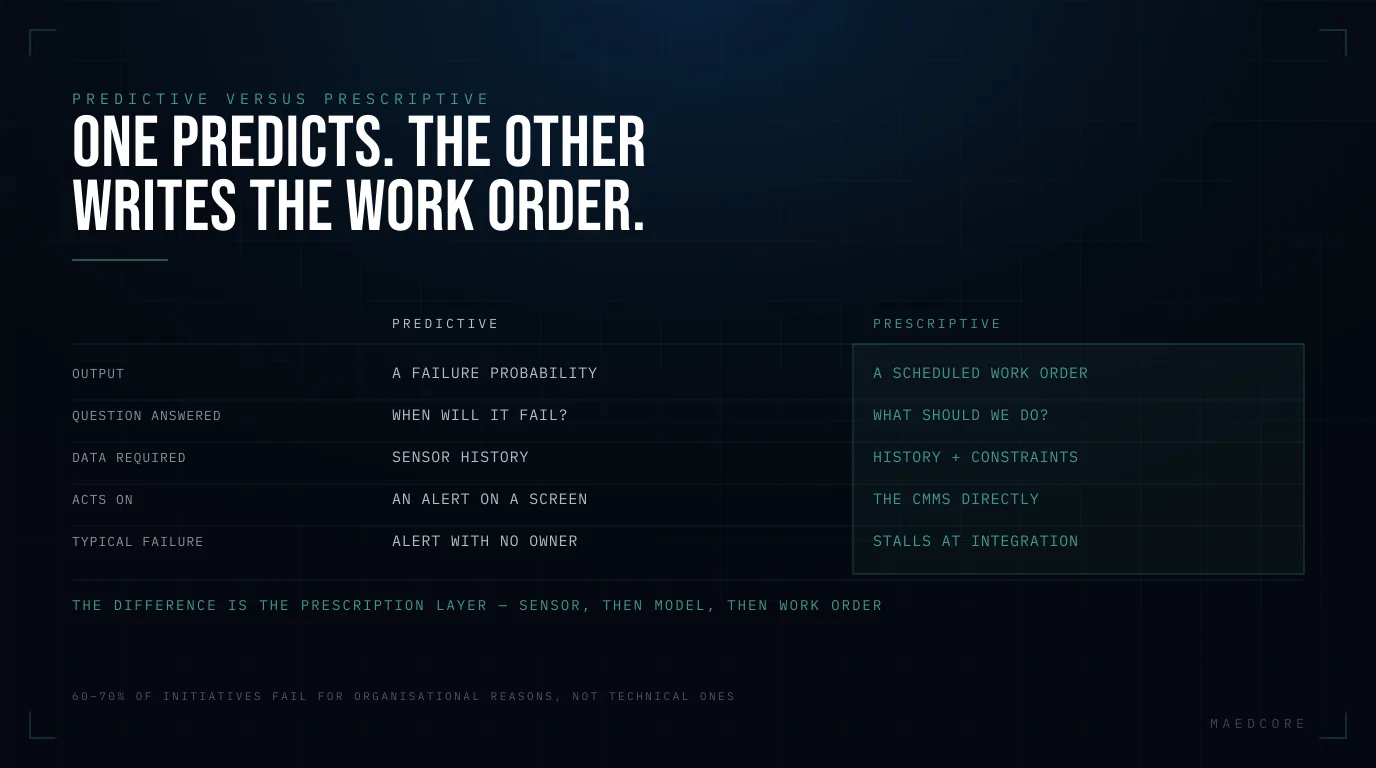
Prescriptive maintenance adds a decision layer on top of predictive: rather than simply alerting you that something is about to fail, it simulates intervention options, weighs costs against parts availability and production windows, and recommends a specific action — with priority, assigned technician, and required spare part already populated. The operational difference is this: predictive opens an alert; prescriptive opens a work order.
For the full maturity ladder — reactive, preventive, predictive, prescriptive — with comparative cost and ROI data, see Predictive vs. Preventive vs. Corrective Maintenance. This post focuses exclusively on what prescriptive adds.
Predictive vs. prescriptive: side-by-side comparison
| Dimension | Predictive maintenance | Prescriptive maintenance |
|---|---|---|
| What it detects | Anomaly or imminent degradation | Same, plus degradation trajectory and remaining useful life |
| What it recommends | ”Inspect the asset" | "Replace SKF 6310-2RS bearing on Saturday at 08:00 — assign J. García” |
| Decision layer | None — alerts the operator | Multi-criteria optimisation: cost vs. production vs. stock vs. risk |
| CMMS integration | Manual or semi-automatic | Auto-generated work order with all fields populated |
| Autonomy | Detects and alerts | Detects, decides, and acts (with or without human validation) |
| Learning loop | Static or periodically retrained | Learns from the outcome of every intervention |
One nuance that vendor articles consistently omit: full autonomy remains a long-term goal. In practice, most systems marketed as “prescriptive” generate work orders that a human validates before execution. Reliable Plant (2026) describes this as “human-in-the-loop” and presents it as the de facto standard for the near and medium term.
Only 27% of manufacturers actively use predictive maintenance today (MaintainX 2025, cited by IIoT World). Prescriptive, at 6% adoption, is an order of magnitude less widespread — organisations that implement it well over the next 24 months have a genuine competitive window.
The sensor → model → action loop: how each link works
The prescriptive loop has three links that must be physically connected. The most common failure point is not the AI model — it is one of the other two.
Link 1: the sensor
Not every sensor detects every failure mode. For early bearing fault detection, you need a triaxial MEMS accelerometer sampling continuously at 2–20 kHz, synchronised to ±1 ms, according to Factory AI (2026). A temperature transducer will detect the fault at stage 3 or 4 — when severe damage has already occurred; the accelerometer catches it at stage 1 or 2, with weeks of lead time.
Mounting matters as much as sensor type. For real-time AI, stud mounting is mandatory. Magnetic mounting is only valid for periodic portable inspections.
72% of surveyed professionals identify data quality and accessibility as the primary barrier to implementing predictive or prescriptive maintenance (Tractian, 2026). In most plants, vibration data sits in a portable collector at 256 Hz, current data lives in the SCADA historian at one-minute intervals, and replacement records are on paper. Aligning those sources is the dominant engineering task — not training the model.
Link 2: the model
There is no single correct model type — the right choice depends on how much historical failure data you have:
| Model type | When to use it | Main limitation |
|---|---|---|
| Statistical baseline (Z-score) | Always — first 3–6 months, cold-start | Does not estimate RUL; detects anomaly only |
| Isolation Forest | Cold-start, scarce failure history | Unsupervised — higher false-positive rate |
| LSTM / GRU (time series) | After 6–12 months of labelled data | Requires historical failures for training |
| Survival model (Weibull) | Partial history, censored data | Assumes a known failure distribution |
| Digital twin (physics + data) | When a thermodynamic asset model exists | High modelling cost |
The cold-start problem — which none of the currently ranking articles actually solve — is this: you buy a system to avoid failures, but the system needs past failures to learn how to avoid them. The practical solution is to start with physics-based anomaly detection (no failure labels required), supplemented by vendor fleet models via transfer learning. Accept a higher false-positive rate in the first six months and use technician feedback to label outcomes and retrain progressively.
Link 3: the prescription layer
The prescription layer is a multi-criteria optimiser. Its inputs are: the model’s RUL estimate, the cost of planned intervention, the cost of unplanned failure, the nearest production window, available parts stock, and certified technician availability. Its output is an action recommendation with all fields needed to generate a CMMS work order without manual intervention.
In an industrial inspection project we built with Mapper, the synchronisation between sensor data, automatic report generation, and asset traceability was exactly the same bottleneck: the data exists, but connecting it so the system produces an actionable document without human intervention requires an integration layer that is routinely underestimated in the initial budget.
The loop closes when the intervention outcome — actual failure mode found, parts used, real repair time, post-repair vibration baseline — feeds back into the model for retraining. Decisyon (2026) puts it precisely: “capturing what action was taken, how long it lasted, and how condition signatures changed” is what turns an advanced predictive system into a genuinely prescriptive one.
Why 60–70% of initiatives fail: the real causes, not the technical ones
Most projects do not fail because of the AI model — they fail before they ever reach it. OxMaint (2025) puts 60–70% of initiatives as failing to reach their ROI target, with three primary causes: workforce resistance, insufficient data quality, and inadequate change management. None of the three is a technical problem.
Pilot purgatory. The pilot on one asset works; scaling to 50 assets does not. The usual reason is that the pilot ran under special conditions — a dedicated technician, clean data, a well-documented asset — that do not replicate in production. Fix: define scale-out criteria before starting the pilot.
Alert fatigue. Many solutions achieve precision below 50%, eroding trust in the system. The technical fix is a persistence timer — the anomaly must remain above threshold for at least four hours before triggering an alert — combined with displaying the model’s confidence score alongside every alert.
VFDs and speed-variation false positives. Variable-frequency drives shift all vibration frequencies. The fix is to ingest RPM data into the model and use Order Analysis instead of fixed-frequency analysis.
Organisational resistance with an inverted ratio. BCG establishes that 70% of the effort in digital transformation should go to people, processes, and culture; 20% to data and technology; and only 10% to algorithms. Most implementations invert this ratio entirely.
Talent gap. More than 70% of companies analysed in the VIII Smart Industry Report 2025 cite the shortage of digital and industrial talent as a primary brake on progress. 74% of European companies have reached a basic level of digitalisation (Eurostat 2025), but only 6% of Spanish SMEs operate at a high level — which makes any prescriptive project a digital transformation project before it is a maintenance project.
The 5-Phase RxM Framework: from sensor to work order (with a real worked example)
This is the section you will not find in any of the currently ranking articles: a gate-by-gate framework that takes a plant manager from “we have some sensors” to “we have a working prescriptive loop”, with explicit go/no-go criteria at each phase and a real numerical example threaded throughout all five.
The example: a centrifugal pump at a chemical plant in the Henares Corridor industrial zone near Madrid. One unplanned failure costs €18,000/hour in lost production plus €4,200 in emergency repair.
Phase 1 — Asset criticality and failure mode mapping
The question: is the investment justified for this asset?
| Criterion | Example pump | Go threshold |
|---|---|---|
| Unplanned downtime cost/hour | €18,000 | > €5,000 → proceed |
| Failure frequency (events/year) | 2.3 | > 1 → proceed |
| Failure detectability (lead time) | 2–6 weeks (vibration signature) | > 72 h → proceed |
| Available redundancy | No standby pump | No redundancy → higher priority |
| Verdict | GO | All 4 criteria met |
Primary failure modes to instrument: (a) bearing wear, (b) cavitation, (c) mechanical seal degradation, (d) impeller imbalance. No-go: if the asset has full redundancy and low downtime cost, the ROI of prescriptive maintenance likely does not justify the investment.
Phase 2 — Sensor selection and placement
The question: which sensor detects which failure mode, and why?
| Failure mode | Sensor type | Location | Sampling rate | Approximate unit cost |
|---|---|---|---|---|
| Early bearing wear | Triaxial MEMS accelerometer | Motor-end bearing housing, stud-mounted | 2–20 kHz | €150–400 |
| Cavitation | High-frequency ultrasonic | Suction pipe, 30 cm from inlet | 40 kHz | €300–600 |
| Seal degradation | PT100 temperature | Mechanical seal housing | 1 Hz | €30–80 |
| Impeller imbalance | Accelerometer (same unit) | Free-end bearing | 2–20 kHz | (shared) |
| Process context | Pressure transducer | Existing SCADA taps | 1 Hz | €80–200 |
| Motor load | Current transformer (CT) | Control panel, one phase | 1 Hz | €50–150 |
Go/no-go criteria: stud-mounted sensors (not magnetic), naming convention locked to the CMMS asset ID, time synchronisation to ±1 ms. A common brownfield error: the sensor carries the ID “X-99” in the gateway but the CMMS knows the asset as “Pump-01” — automation breaks the moment the system tries to generate a work order.
Phase 3 — Model selection and training
The question: which AI model is right given the data we have right now?
The correct approach is to establish a unique baseline for each asset during a period of normal load. Set the alert threshold at Mean + 2σ and the alarm threshold at Mean + 3σ. This detects changes relative to that specific machine’s normal behaviour, not an arbitrary global standard.
Cold-start solution: in the first 3–6 months, use physics-based anomaly detection (Isolation Forest or Z-score) — no failure labels required. Supplement with vendor fleet models via transfer learning where available. Accept a 20–30% false-positive rate during this phase and use technician feedback to label outcomes and retrain. An LSTM or survival model only enters the picture once you have three or more labelled failure events, typically from month 9–12 onward.
Go/no-go to advance: model validated against ≥3 known historical events; false-positive rate < 20% before activating the prescription layer.
Phase 4 — The prescription layer: the decision optimiser
The question: how does the system turn a RUL estimate into a concrete action?
Model output — bearing in stage-2 wear:
Inner race defect frequency (BPFI) elevated 2.8σ above baseline. RUL estimate: 18–26 days (80% confidence interval). Failure mode: progressive spalling.
Prescription optimiser calculation:
- Cost of planned repair: €1,200 (bearing + 4 h labour)
- Production loss from planned repair: €0 (scheduled downtime window in 9 days)
- Probability of failure before the window: 35% (lower RUL bound of 18 days > 9-day window)
- Cost of emergency repair if failure occurs: €4,200 + €18,000/h × 3 h = €58,200
- Expected cost of not intervening: 0.35 × €58,200 = €20,370
Auto-generated work order:
“PRIORITY 2 — Schedule bearing replacement at next planned shutdown (Saturday 08:00). Part: SKF 6310-2RS (in stock, Shelf B-14, Qty: 2). Assign: Technician J. García (bearing-certified). Estimated duration: 3.5 h. If vibration exceeds 4.2σ before Saturday, escalate to PRIORITY 1 (immediate shutdown).”
The operational difference: the system does not say “check the motor” — it specifies exactly which part to replace, where it is in the warehouse, who should do the work, and when to escalate. The anomaly is validated against a 4-hour persistence timer to rule out transient impacts, and the model’s confidence score is displayed alongside the work order so the technician has enough context to accept or override it.
Phase 5 — The feedback loop: what makes the system genuinely prescriptive
The question: how does the system learn from each intervention to improve the next recommendation?
Without loop closure, the system is advanced predictive, not prescriptive. Closure requires capturing five minimum fields when the work order is closed:
- Was the prescription followed? (Yes/No — and if not, why?)
- Actual failure mode found (does it match the prediction?)
- Parts actually used
- Actual repair time vs. estimated
- Post-repair vibration baseline (to reset the asset model)
Go criteria for scale-out: prescription acceptance rate ≥ 80%, failure mode match rate ≥ 70%, defined model retraining cadence (minimum monthly).
Realistic budget: brownfield plant, 5 critical assets
| Line item | Unit cost | Quantity | Total |
|---|---|---|---|
| Triaxial IIoT vibration sensor (wireless, IEC 61010) | €250–500 | 10 (2/asset) | €2,500–5,000 |
| Temperature / process sensors (if not already installed) | €80–200 | 10 | €800–2,000 |
| Industrial IoT gateway (LoRaWAN / 4G, ATEX if required) | €400–1,200 | 2 | €800–2,400 |
| PdM/RxM platform licence (SaaS, per asset/year) | €800–2,500 | 5 assets | €4,000–12,500/yr |
| CMMS integration (API connector, one-off) | €3,000–8,000 | 1 | €3,000–8,000 |
| Data engineering / model setup (external consultant) | €150–250/day | 20–40 days | €3,000–10,000 |
| Year 1 total | €14,100–39,900 |
Spain’s Kit Digital and Activa Industria 4.0 programmes may subsidise the software and integration line items for eligible SMEs.
Industry reference ROI: predictive maintenance reduces unplanned stoppages by 30–50% and maintenance costs by 10–25%, with a payback period of 12–24 months, according to IMARC Group (2025). Prescriptive should improve on these ranges for critical assets with no redundancy — but treat the upper end with caution: IoT Analytics (2024) documents that 95% of adopters report positive ROI, but the sample covers predictive maintenance broadly, not prescriptive specifically.
Where the sources disagree: what to know before citing any figure
Market research firms publish radically different numbers with no accessible methodology. For 2025, global predictive maintenance market estimates range from USD 9.2 billion (Precedence Research) to USD 16.42 billion (SkyQuest). IoT Analytics — the only firm with a traceable methodology in this space — values it at USD 5.5 billion, well below all the others. The divergence likely reflects different scope definitions: pure PdM software vs. the full IIoT stack including hardware.
On ROI: IMARC Group puts maintenance cost reduction at 10–25%, while Verified Market Research publishes reductions of 10–40% and downtime cuts of 70–90%. The upper end (90% downtime reduction) is not corroborated by any identified primary source and should be treated as aspirational. When evaluating vendor proposals, always ask for the assumptions behind any ROI figure.
Related reading
- Predictive vs. Preventive vs. Corrective Maintenance — the cost and ROI comparison that decides which strategy fits which asset.
- Industrial Machinery Maintenance — why the constraint moved from the inspection visit to manual post-processing.
- Predictive Maintenance with AI — the sensor-and-model side: what IoT data and machine learning actually contribute.
- Automated Visual Inspection — what accuracy is realistic, and the three gates a vision system has to clear first.
- Digital Work Orders — closing the loop: how the job gets assigned, executed and traced without paper.
- Artificial Intelligence Applications in Industry: 6 Real Examples (2026) — verified industrial ML use cases, including maintenance
- Maedcore — Digital Solutions — what we build in this area.
Frequently Asked Questions
What is the difference between predictive and prescriptive maintenance?
Predictive maintenance detects that an asset is about to fail and raises an alert. Prescriptive maintenance adds an optimisation layer that evaluates intervention options — repair now, wait for the next planned shutdown, increase monitoring — weighing cost, production impact, parts stock, and technician availability, then automatically generates a fully populated work order. The operational difference: predictive opens an alert; prescriptive opens a work order.
What is the cold-start problem and how do you solve it?
The cold-start paradox is that the system needs historical failures to learn how to predict them, but you are buying it precisely to avoid those failures. The practical solution is to start with physics-based anomaly detection — Isolation Forest or Z-score — which requires no failure labels, supplemented by vendor fleet models via transfer learning where available. Accept a higher false-positive rate in the first six months and use technician feedback to label outcomes and retrain progressively.
Why do so many predictive and prescriptive maintenance projects fail?
According to OxMaint (2025), 60–70% of initiatives fail to reach their ROI target. The primary causes are not technical: poor data quality, incorrect sensor mounting, OT/IT silos, workforce resistance, and the inability to scale a successful pilot across the plant (“pilot purgatory”). BCG establishes that 70% of the effort should go to people, processes, and culture — most implementations invert this ratio entirely.
How much does prescriptive maintenance cost to implement?
For a brownfield plant with five critical assets, total first-year cost ranges from approximately €14,100 to €39,900, covering sensors, gateway, SaaS platform licence, CMMS integration, and data engineering consultancy. Spain’s Kit Digital and Activa Industria 4.0 programmes may subsidise the software and integration items for eligible SMEs, meaningfully reducing the initial outlay.
How long does it take for a prescriptive maintenance system to work?
A realistic timeline: 2–4 weeks for asset selection and sensor specification; 2–6 weeks for installation; 3–6 months to collect baseline data; 1–3 months to train and validate the model; 1–2 months to integrate the prescription layer with the CMMS. The first auto-generated work order typically arrives 9–12 months after kick-off. The week-level timelines that vendor marketing promises are only achievable on assets with pre-existing, clean data histories.
Sources
- Fracttal — Estado del Mantenimiento Predictivo 2024 — Fracttal, 2024
- IoT Analytics — Predictive Maintenance Market: 5 Highlights for 2024 — IoT Analytics, September 2024
- IIoT World — AI Predictive Maintenance 2026: A Manufacturing Guide — IIoT World, August 2026
- IMARC Group — Predictive Maintenance Market Size, Share & Forecast 2034 — IMARC Group, 2025
- OxMaint — Top Challenges in Implementing Predictive Maintenance — OxMaint, September 2025
- Tractian — Data Quality Issues That Cause Predictive Maintenance Challenges — Tractian, June 2026
- Reliable Plant — Transforming Maintenance with AI: From Predictive Insights to Prescriptive Action — Reliable Plant, February 2026
- Decisyon — Prescriptive vs. Predictive Maintenance: What Actually Changes on the Floor — Decisyon, 2026
- Factory AI — Sensor Predictive Maintenance: The 2026 System Integrator Guide — Factory AI, February 2026
- LYL Ingeniería — VIII Informe Smart Industry 2025 — LYL Ingeniería / Smart Industry, December 2025
- El Ecosistema Startup — Industria 4.0 España: solo 3,3% de fábricas digitalizadas — El Ecosistema Startup, citing Eurostat 2025, May 2026
About the Author
Robotics Engineer
For over a decade, I have been driven by a single mission: leveraging AI and robotics to build a world of automated production. I believe that by creating self-sufficient systems, we can empower people to refocus on what truly matters—their families and their passions. My expertise spans from winning prestigious European startup competitions to architecting complex, integrated hardware and software projects. I specialize in bridging the gap between today's industrial challenges and tomorrow's autonomous solutions.
Frequently Asked Questions
What is the difference between predictive and prescriptive maintenance?
What is the cold-start problem in prescriptive maintenance and how do you solve it?
Why do so many predictive and prescriptive maintenance projects fail?
How much does it cost to implement prescriptive maintenance?
How long does it take for a prescriptive maintenance system to deliver results?
Ready to transform your company?
Book a free 30-minute meeting with an engineer.