Digital Technical Documentation: How to Move from Paper to Automated Reports in Industrial Inspection
Cut the bottlenecks of paper-based inspection documentation: a stage-by-stage cost model, regulatory framework and implementation guide for industrial

Written by Eduardo Fuentevilla Blanco
Robotics Engineer at Maedcore · Robotics Engineer LinkedIn ↗
Key Takeaways
- ► The full paper inspection report lifecycle consumes 3–5.5 hours per event; digitalisation reduces this to 55–110 minutes, containing error risk exclusively in the field capture stage.
- ► Manual data entry error rates run at 1–4% per field under controlled conditions (Barchard & Pace, 2011) and can scale to 18–40% under time pressure — in regulated documentation, a single error can invalidate the entire report.
- ► For one inspector completing two daily inspections, the total addressable cost of the paper workflow — labour plus error correction — ranges from €26,400 to €44,000 per year, excluding re-inspections and regulatory penalties.
- ► ENAC has formally recognised digital inspection workflows in Annex V of the CGA-ENAC-OCI, including remote and hybrid inspections, provided technical equivalence and documentary traceability are guaranteed.
- ► Offline-first operation with automatic sync and automatic photo-to-finding linkage at the point of capture are the two non-negotiable technical requirements for any digital inspection tool in industrial field use.
Digitalising industrial inspection documentation eliminates the data re-entry phase that generates between 45 and 90 minutes of administrative overhead per event and an error rate of 1–4% per field accumulated across six workflow stages. For a single inspector completing two inspections per day, the full paper lifecycle cost — labour plus error correction — can reach €26,400–€44,000 per year. Spain’s national accreditation body ENAC has formally recognised digital inspection workflows in Annex V of the CGA-ENAC-OCI, removing the last regulatory barrier to adoption. This article breaks down the exact cost, stage by stage, and provides a decision model that any operations manager can apply to their own facility.
The Real Problem: the Inspector with the Clipboard
Industrial inspection documentation remains, in most plants, a double-entry process: the inspector collects data on paper and someone re-keys it in the office. That second step adds no value — only time, cost and error risk.
According to LNS Research data reported by OrcaLean, 67% of manufacturers report audit-readiness problems caused by disconnected or incomplete paper inspection records. The dysfunction is structural, not anecdotal.
The paradox is that digital adoption in manufacturing is not lagging overall. In 2025, 60.38% of European enterprises used ERP software to share information across functional areas, above the EU average according to Eurostat. Companies have digitalised finance and supply chain — but left the inspector with a clipboard.
How Much Does Paper-Based Technical Documentation Actually Cost?
The visible cost is data re-entry time; the invisible cost is the error rate that accumulates at each stage and, in regulated inspection, can invalidate the entire report.
Two Figures That Look Contradictory — and Aren’t
Two numbers appear in the field digitalisation literature that seem to conflict at first glance:
- With a standardised digital template, most reports are completed in 5 to 10 minutes in the field, versus 15–30 minutes for a paper form. Source: Scoop, 2026.
- The total administrative burden per report is 45 to 90 minutes, according to ServiceTitan research on field operations. Source: Hallian Tech, 2026.
They don’t contradict each other: they measure different stages of the same broken workflow. The 5–10 minutes is field capture time with a digital form; the 45–90 minutes is office-side report assembly time, which disappears entirely in the digital workflow. Conflating the two leads to a systematic underestimate of the real saving.
Data Entry Errors: a Scale Problem
The manual data entry error rate sits between 1% and 4% per field for experienced operators under controlled conditions, according to Barchard & Pace (2011) in Behavior Research Methods. Under time pressure or in complex field environments, some studies have observed rates scaling to 18–40%, according to DigiParser (2026). For industrial inspection, the reasonable range is at the conservative lower end — but even so the impact is significant: a report with 40 fields has a statistically meaningful probability of containing at least one error.
Thomas C. Redman in Harvard Business Review (2017) documented that 47% of newly created data records contain at least one critical error, and that only 3% of data quality scores qualify as ‘acceptable’ under the most lenient possible standard. Redman also describes the ‘hidden data factory’: supervisors who silently correct inspector notes before filing the report — a real cost that never appears in any efficiency report.
The 1-10-100 rule holds that fixing an error costs 1 unit at the point of capture, 10 during processing and 100 when it reaches compliance systems. Source: DocuProx, 2025. In regulated inspection, the asymmetry is amplified: an error in a legally binding report can invalidate the entire document and trigger a re-inspection.
The Inspection Report Lifecycle Cost Model
What does not exist anywhere online is a cost model with explicit assumptions that maps every stage of the paper inspection workflow, assigns a time and an error probability to each, and shows — stage by stage — what digitalisation eliminates. Here is that model.
Model Assumptions
- Inspector: intermediate level (neither novice nor expert).
- Inspection complexity: medium (20–40 checklist items, 10–20 photos).
- Re-entry cost: administrative assistant at €18–22/hour (fully loaded cost).
- Pace: 2 inspections per inspector per day, 220 working days/year.
- Error correction cost: €50–150 per error (conservative estimate, based on DigiParser/DocuProx ranges).
Table: The Six Stages of the Document Lifecycle
| Stage | Paper workflow | Time | Error vector | Digital workflow | Time | Error vector |
|---|---|---|---|---|---|---|
| 1. Pre-inspection prep | Print checklist; review previous paper reports | 20–30 min | Outdated version; lost document | Template loaded automatically; previous findings pre-populated | 2–5 min | Virtually zero |
| 2. Field capture | Handwritten notes; photos taken separately on phone | 45–90 min | Illegibility; omissions; photo-finding mismatch | Structured digital form; photos geotagged and attached automatically | 45–90 min | Structural validation prevents omissions |
| 3. Transport and handover | Physical form travels with the inspector | 0–240 min delay | Loss, damage, delay | Data synced on leaving the field (offline-first) | 0 min | No transport risk |
| 4. Re-entry and assembly | Admin re-transcribes findings into Word/Excel template; manually attaches photos | 45–90 min | 1–4% error per field; incorrect photo attribution | Report generated automatically; zero re-entry | 0 min | Zero re-entry errors |
| 5. Review and correction cycle | Supervisor reviews, returns for corrections; re-transcription required | 30–60 min | Second transcription layer | Digital review with inline comments; corrections at source | 5–10 min | Audit trail maintained |
| 6. Filing and retrieval | Report filed in physical folder; manual retrieval | 15–30 min per retrieval | Loss, misfiling | Digital record with search; linked to asset on 3D map | <1 min | Zero retrieval errors |
| TOTAL per event | ~3–5.5 hours | Accumulated across 6 stages | ~55–110 min | Contained in Stage 2 |
Worked Annual Calculation
Labour cost:
- 2 inspections/day × 220 days = 440 inspection events/year
- Time saving per event: ~2–4 hours → 880–1,760 hours/year
- At €20/hour: €17,600–€35,200/year in labour alone
Error correction cost:
- 1% error rate on 40 fields × 440 events = 176 errors/year
- At €50 per error (conservative end): €8,800/year in rework
Total addressable cost: ~€26,400–€44,000/year for a single inspector’s workflow
Engineering judgement: this estimate is conservative. It excludes the risk of regulatory penalties, the cost of re-inspections triggered by invalid reports, and the opportunity cost of inspector time spent on administrative tasks. For an organisation with five field inspectors, the range scales linearly to €132,000–€220,000/year.
In an inspection project we built for ENUSA Industrias, eliminating manual re-entry of radiation measurement data was precisely the starting point of the business case — not the technology itself, but the time and risk that the paper workflow generated in every measurement cycle.
How to Implement the Transition: Phases, Timelines and Selection Criteria
The paper-to-digital transition is a sequenced programme that replaces the highest-value records first, captures ROI to fund later phases, and manages adoption by demonstrating value before demanding behaviour change.
Phase 1 — Form digitalisation (2–4 weeks): Identify the 3–5 highest-frequency inspection forms. Track the adoption rate; the target is above 90% within the first three weeks. Any rate below that signals a specific resistance point — a training gap, device availability issue or form design problem — that must be resolved before moving on.
Phase 2 — Automated report configuration (4–6 weeks): Map captured fields to the report template. Configure automatic photo attachment and signature capture. The goal is that no data captured in the field requires manual re-transcription to produce the final report.
Phase 3 — Spatial integration and asset mapping (8–16 weeks): Requires an asset inventory, coordinate data or drawing import. This phase transforms technical documentation from a chronological archive into an analytical tool: by linking each finding to its georeferenced location, it becomes possible to identify failure patterns by zone, asset or inspector — something no paper archive allows.
ROI visibility: typically 60–90 days after Phase 1 go-live.
Tool Selection Criteria
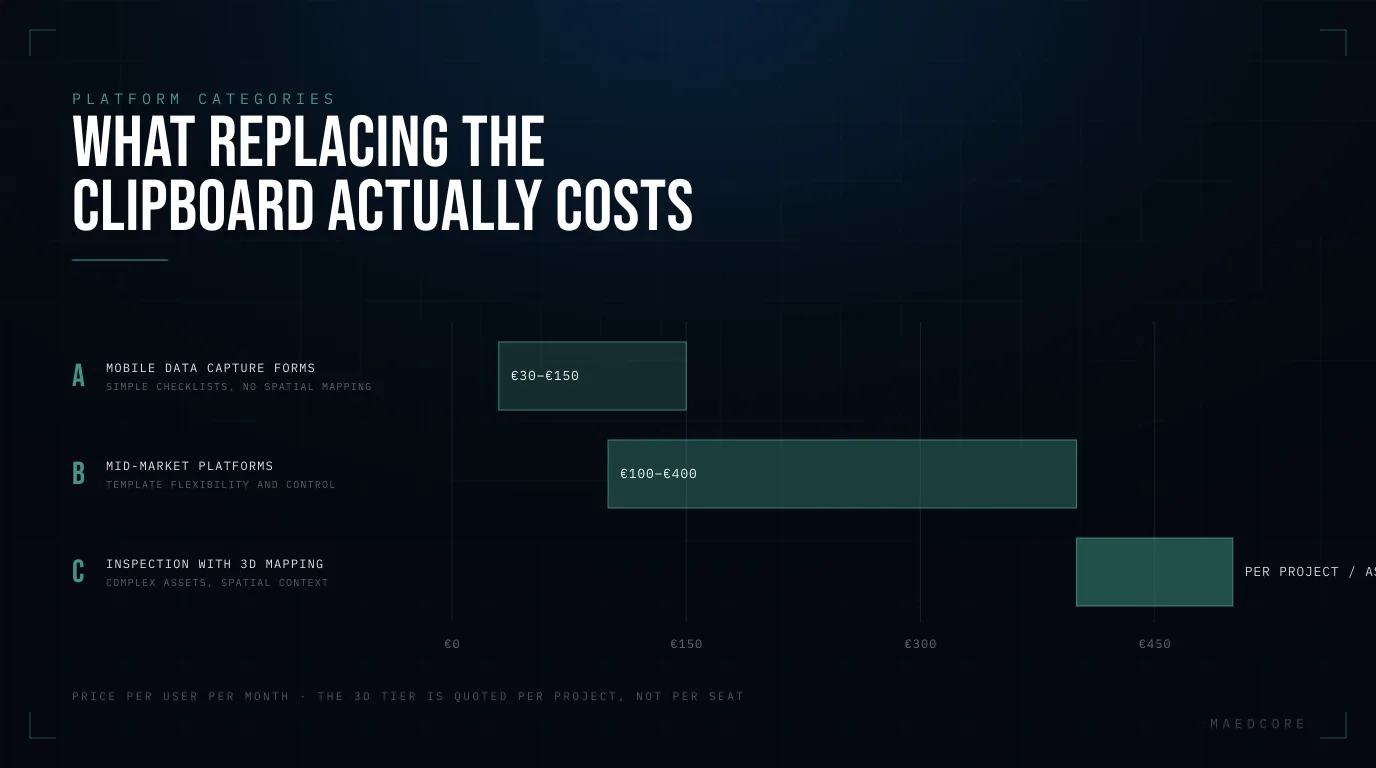
| Category | Examples | Indicative price | Best suited for |
|---|---|---|---|
| Mobile data capture forms | GoAudits, iAuditor/SafetyCulture | €30–150/user/month | Simple checklists; no spatial mapping |
| Mid-market platforms | Field Eagle, Weever | €100–400/user/month | Greater template flexibility and corrective action workflows |
| Inspection with 3D mapping | Mapper category | Per project/asset | Complex asset inventories; spatial analysis |
For capture hardware, the practical choice for most industrial SMEs is not a ruggedised tablet (€1,500–3,500) but a consumer tablet with a reinforced case (€400–900). The durability difference rarely justifies the cost premium in standard inspection environments — except in extreme temperature, dust or humidity conditions.
The Regulatory Framework: ISO/IEC 17020, ENAC and Annex V
The regulatory framework already permits — and in some cases incentivises — digital inspection. The barrier is not normative; it is operational.
ENAC published Annex V of the CGA-ENAC-OCI establishing specific criteria for the use of electronic and digital means in inspection activities, with guidelines to ensure the technical validity and reliability of the evidence obtained. Annex V explicitly recognises the possibility of conducting remote or hybrid inspections — using cameras, drones or IoT systems — provided that technical equivalence with on-site inspection is guaranteed and the principles of competence, impartiality and documentary control are maintained.
In the Madrid region, the Dirección General de Promoción Económica e Industrial is the regulatory authority for inspection technical documentation produced by OCI/OCP bodies operating in the Madrid industrial corridor. The transition to digital records must be consistent with its technical criteria.
Practical point: a digital tool that does not produce a tamper-evident, auditable record will fail an accreditation review. Data traceability — who captured what, when and from which device — is not an optional feature; it is an accreditation requirement.
Common Mistakes That Derail Digitalisation
Most digital technical documentation projects that fail do so for predictable reasons.
1. Digitalising a broken process. If the paper form has redundant fields or ambiguous criteria, digitalising it preserves the dysfunction. Digitalisation is the ideal moment to redesign the form together with the inspectors who use it.
2. Ignoring field connectivity. Many industrial facilities have no reliable mobile signal — pressure vessels, underground infrastructure, remote sites. Any digital capture tool must support offline-first operation with automatic sync when connectivity is restored. Failing to validate this before deployment is the most common cause of inspector resistance and reversion to paper.
3. Adoption below the 90% threshold. Running parallel systems — paper and digital — beyond the transition period doubles the workload and destroys the ROI case.
4. Unstructured photo volume. Without automatic photo-to-finding linkage at the point of capture, digital tools simply move the problem from a photo folder to the report — without saving any assembly time.
5. Ignoring ENAC Annex V for accredited bodies. A tool that does not generate a fully traceable, tamper-resistant record will fail the next accreditation audit — with consequences that go well beyond the cost of the tool itself.
Frequently Asked Questions About Digital Technical Documentation in Inspection
Are digital inspection records valid for ISO/IEC 17020 accreditation?
Yes. ENAC published Annex V of the CGA-ENAC-OCI to establish the technical validity criteria for digital means in inspection. The key requirement is that the system records who captured each data point, when and from which device, and that this record cannot be modified without leaving an audit trail — without that traceability, a digital record will not pass an accreditation review.
What is the manual data entry error rate in inspection forms?
Between 1% and 4% per field for experienced operators under controlled conditions, according to Barchard & Pace (2011) in Behavior Research Methods. Under time pressure in field conditions, some studies have observed rates of up to 18–40% according to DigiParser (2026). In a report with 40 fields, even the conservative rate implies a statistically meaningful probability of containing at least one error — with potentially serious consequences in regulated documentation.
Can an inspector use the digital tool without an internet connection in the field?
They must be able to. Many industrial facilities have no reliable mobile coverage — pressurised vessels, underground infrastructure, remote installations. Any platform that does not support offline-first operation with automatic sync when connectivity is restored is not fit for industrial field use, and its absence is the most frequent cause of abandonment and reversion to paper.
What is the real annual saving from digitalising inspection technical documentation?
For an inspector completing two inspections per day over 220 working days, the administrative labour saving ranges from €17,600 to €35,200 per year. Adding error correction costs (approximately €8,800/year at a 1% rate and €50 per error), the total addressable cost sits between €26,400 and €44,000 per inspector per year — excluding the cost of re-inspections triggered by invalid reports or regulatory penalties.
What does 3D asset mapping add over a simple digital form?
A digital form eliminates data re-entry and generates the report automatically — enough to capture the labour ROI. A 3D asset map adds analytical capability: by linking each finding to its georeferenced location, it becomes possible to identify failure patterns by zone, asset or inspector, prioritise preventive maintenance and generate spatial evidence for audits. It is the difference between a chronological archive and a decision-making tool.
Related reading
- Work Instructions Beyond the PDF — the wider picture: what replaces the PDF and how to decide where to start.
- Digital Work Instructions on the Shop Floor — what it looks like at the workstation: AR, tablets and step-by-step interactive procedures.
- Safe Work Procedures — the permit-to-work and safety-audit case, with a verifiable real-time record.
- Digital Work Orders — closing the loop: how the job gets assigned, executed and traced without paper.
- Industrial Machinery Maintenance — why the constraint moved from the inspection visit to manual post-processing.
- Maedcore — Digital Solutions — what we build in this area.
Sources
- ENAC — La digitalización en las actividades de inspección industrial — ENAC (Entidad Nacional de Acreditación), Spain, 2024/2025.
- Harvard Business Review — “Only 3% of Companies’ Data Meets Basic Quality Standards” — Thomas C. Redman / HBR, 2017.
- Eurostat — Digital Economy and Society Statistics: Enterprises — Eurostat, 2026.
- Comunidad de Madrid — Documentos técnicos de instalaciones contra-incendios industriales — Comunidad de Madrid, 2025.
- Parsli — 67 Data Entry Statistics & Automation Trends (2026 Update) — Parsli (citing Barchard & Pace, 2011, Behavior Research Methods), 2026.
- DigiParser — Manual Data Entry Error Rate — DigiParser, 2026.
- DocuProx — Hidden Costs of Manual Data Entry — DocuProx, 2025.
- Hallian Tech — Your Field Staff Are Spending 100 Hours a Week Writing Reports — Hallian Tech, 2026.
- Scoop — Field Service Report: Complete Guide (2026) — Scoop, 2026.
- OrcaLean — Mobile Quality Inspections for U.S. Manufacturers — OrcaLean (citing LNS Research), 2025.
- Maedcore — Radiation Inspection for ENUSA Industrias — Maedcore, success story.
About the Author
Robotics Engineer
For over a decade, I have been driven by a single mission: leveraging AI and robotics to build a world of automated production. I believe that by creating self-sufficient systems, we can empower people to refocus on what truly matters—their families and their passions. My expertise spans from winning prestigious European startup competitions to architecting complex, integrated hardware and software projects. I specialize in bridging the gap between today's industrial challenges and tomorrow's autonomous solutions.
Frequently Asked Questions
Are digital inspection records valid for ISO/IEC 17020 accreditation?
What is the manual data entry error rate in inspection forms?
Can an inspector use the digital tool without an internet connection in the field?
What is the real annual saving from digitalising inspection technical documentation?
What does 3D asset mapping add over a simple digital inspection form?
Ready to transform your company?
Book a free 30-minute meeting with an engineer.