How to Calculate the ROI of a Virtual Demo for Industrial Machinery Sales
A six-step model to calculate ROI and break-even for a virtual demo programme for industrial machinery sales. Real data, explicit assumptions.

Written by Eduardo Fuentevilla Blanco
Robotics Engineer at Maedcore · Robotics Engineer LinkedIn ↗

Key Takeaways
- ► Exhibiting at an industrial trade show costs €30,000–€150,000 all-in per event; the cost per demo delivered ranges from €500 to €5,000 — that is the correct denominator for evaluating any digital alternative.
- ► A virtual demo programme for industrial machinery costs €15,000–€300,000 to build and €8,000–€60,000/year to operate; the cost per virtual demo falls to €80–€400, but only becomes competitive above roughly 30 demos per year.
- ► Industrial machinery sales cycles average 130 days (270 days for deals above €500,000) with up to 11 decision-makers: SaaS demo conversion statistics (33-day cycles, 7.9× improvement) are not applicable without adjustment.
- ► Break-even through physical demo substitution is reached at around 30 demos/year; a conservative 10% cycle compression and +1 pp close-rate improvement generate a projected ROI of 278% on the worked example.
- ► The most common failure modes are under-budgeted CAD retopology (€5,000–€20,000), missing CRM integration and sales team non-adoption — operational issues, not technical ones.
- ► The greatest structural advantage of a virtual demo for capital equipment is the ability to share saved configurations asynchronously with all 6–11 members of the buying committee without coordinating site visits.
Exhibiting at three industrial trade shows a year can cost between €90,000 and €450,000 in total; a properly scoped virtual demo programme for industrial machinery can deliver the same number of demonstrations for roughly one-tenth of that unit cost. This article builds a six-step model — with real numbers and explicit assumptions — so any sales director or engineering lead can calculate their break-even threshold and expected ROI before committing budget. The starting point is always the cost of the physical demo, not SaaS-ecosystem conversion statistics.
Why the true cost of demonstrating industrial machinery is the right starting point
The all-in cost of exhibiting at an industrial trade show — stand, logistics, travel and engineering time — runs from €30,000 to €150,000 per event; that denominator is what makes any ROI calculation for a digital alternative meaningful.
Data from EXHIBITOR Magazine and CEIR are consistent: a 10×10 m inline stand costs between $30,000 and $50,000 all-in, while a 20×20 m island booth climbs to $80,000–$150,000. The budget split is well-documented: floor space (33%), stand construction and graphics (18%), travel and accommodation (18%), on-site services (12%), freight (9%), promotion (8%) and miscellaneous (2%). The floor rental is only a third of the total; the rest multiplies the investment three to five times over.
For industrial machinery sales, the metric that actually matters is not the total stand cost but the cost per demo delivered. If a two-engineer team runs 15 demonstrations over a four-day show at a total cost of €45,000, the unit cost is €3,000 per demo. That is the number to benchmark any virtual alternative against.
Here the published sources diverge in an instructive way. CEIR puts the cost of closing a trade-show lead at $811, versus $1,039–$1,356 for a field-sales lead. Another widely cited figure puts the cost per trade-show contact at just $112, compared with $259 for a sales visit. The gap is not a contradiction: $112 is the cost per contact, while $811 is the cost per closed deal, once the conversion rate is applied. Mixing the two figures in an ROI model is the single most common error in this type of analysis.
What it actually costs to build a virtual demo programme for industrial equipment
A virtual demo programme for industrial machinery requires an upfront investment of €15,000 to €300,000, with annual operating costs of €8,000 to €60,000; the range is wide because the type of 3D asset and the level of visual fidelity are the variables that drive cost most.
Industry references put simple VR application development at around $20,000, with complex projects reaching $500,000. High-quality 3D asset modelling costs between $2,000 and $8,000 per realistic asset, and for industrial machinery, photogrammetry-scanned or custom-modelled environments can add a further $20,000 to $80,000. 3D content creation, multi-device testing and post-launch maintenance typically add 30–40% to the initial estimated budget.
There is a hidden cost that almost no initial budget captures: engineering CAD files are not render-ready 3D assets. A SolidWorks or CATIA model contains internal geometry and polygon densities that are unusable in real-time engines without prior retopology. In our experience on industrial visualisation projects, this step costs between €5,000 and €20,000 and is the most common cause of schedule overruns. Budgeting it from day one is not optional.
The European market is beginning to offer subscription alternatives: VISARD, a European specialist in industrial VR showrooms, advertises entry points from €999/month — a model that lowers the upfront investment barrier but creates vendor dependency for asset updates.
The table below summarises the four programme archetypes:
| Programme type | Build cost | Annual operating cost | Best use case |
|---|---|---|---|
| Web 3D configurator (WebXR/browser) | €15,000–€40,000 | €8,000–€20,000 | Top-of-funnel, self-service |
| Standalone VR demo (single product family) | €40,000–€120,000 | €15,000–€30,000 | Engineer-guided demo, late stage |
| Full VR showroom (multi-product) | €100,000–€300,000 | €25,000–€60,000 | Trade-show replacement, key accounts |
| Interactive SaaS demo (screen-based) | €5,000–€15,000 | €5,000–€15,000 | Remote qualification, early stage |
Development timelines range from 6–8 weeks for simple applications to up to 12 months for advanced experiences. For a mid-complexity industrial demo — one product family, 3–5 configuration options, photorealistic rendering from existing CAD — a realistic timeline from file handover to a deployable demo is 3 to 5 months.
The industrial machinery sales cycle: the denominator that changes everything
With average sales cycles of 130 days — and over 270 days for deals above €500,000 — and buying committees of up to 11 stakeholders, industrial machinery has dynamics that are radically different from the SaaS software deals that dominate published conversion studies.
The manufacturing and industrial equipment sector records average sales cycles of 130 days. For deals above $500,000 in annual contract value, the figure reaches 270 days. The average B2B buying committee involves 6.8 decision-makers, a number that rises to 11.2 for contracts with an annual value above $50,000.
This context makes the most widely cited conversion studies directly inapplicable. The 2024 Storylane/Factors.ai study, which analysed more than 110,257 web sessions and 150 deals, reports a 7.9× conversion improvement and a cycle compression from 33 to 27 days. These figures come from SaaS software demos with a 33-day baseline cycle. Applying them directly to industrial machinery with 130–270-day cycles is a methodological error. The directional signal — interactive demos accelerate cycles and improve conversion — is credible; the magnitude is not transferable without adjustment.
What is directly relevant is the shift in buyer behaviour. McKinsey’s 2024 B2B Pulse survey (nearly 4,000 respondents across 34 sectors in 13 countries) shows that B2B decision-makers now split their time equally across traditional, remote and digital self-service channels. More importantly, 39% of B2B buyers — up from 28% two years earlier — say they are willing to spend more than $500,000 per order through digital or remote channels. 70% define their requirements completely before speaking to sales. With 11 stakeholders on the buying committee, the ability to share a demo asynchronously is the most underrated structural advantage of this type of tool.
The calculation model: six steps to work out the ROI of your virtual demo programme
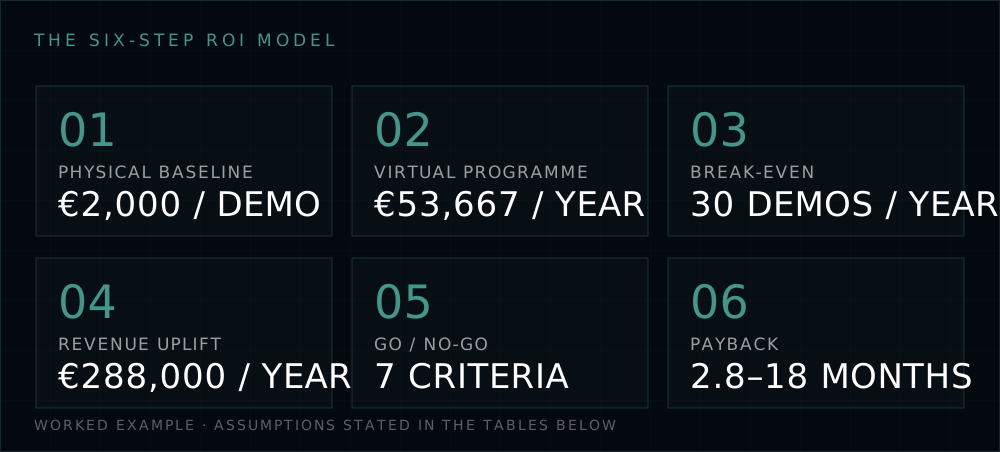
The ROI of a virtual demo programme for industrial machinery is calculated in six steps: establish the unit cost of the physical demo, estimate the unit cost of the virtual demo, calculate the break-even threshold, model the revenue-uplift scenario with conservative assumptions, apply a go/no-go decision matrix, and calculate payback in months.
This model does not exist in any published source at this level of specificity for industrial equipment. SaaS demo platforms (Navattic, Demostack, Storylane) offer ROI calculators, but all of them assume 30–90-day cycles and treat the cost of the physical demo as irrelevant. The model developed below uses the real cost of an industrial trade show as its denominator.
Step 1 — Physical demo baseline (annual)
| Cost line | Inputs required | Reference range |
|---|---|---|
| Trade-show stand (all-in, per event) | No. of events/year × stand size | €30,000–€150,000/event |
| Demo logistics (machinery transport) | Weight, distance | €5,000–€40,000/event |
| Engineer travel and time | No. of engineers, daily rate | €3,000–€15,000/event |
| Qualified leads generated | Stand traffic × qualification rate | 20–150/event |
| Cost per demo delivered | Total cost ÷ demos run | €500–€5,000 |
Worked example: A company exhibiting at 3 shows a year with a total cost of €120,000 and delivering 60 demos in total has a cost per demo of €2,000.
Step 2 — Virtual demo programme cost (annualised)
The build investment is amortised over three years, a reasonable asset lifecycle for 3D assets before a major refresh.
| Cost line | Inputs required | Reference range |
|---|---|---|
| 3D/VR asset build (amortised over 3 years) | Product complexity, no. of SKUs | €25,000–€120,000 |
| Platform licence / hosting | SaaS or self-hosted | €10,000–€40,000/year |
| Sales engineer time per virtual demo | Duration × day rate | €150–€600/demo |
| Annual update and maintenance | Frequency of product changes | 15–20% of build cost |
| Cost per virtual demo delivered | Total annual cost ÷ demos | €80–€400 |
Worked example (continued): Build cost €80,000 amortised over 3 years = €26,667/year. Platform: €15,000/year. Maintenance (15% of €80,000): €12,000/year. Total fixed annual cost: €53,667. At 45 minutes per demo and an internal day rate of €400, the variable cost is €225/demo. At 100 demos per year: €53,667 + (100 × €225) = €76,167 → cost per demo: €762.
Note: If volume stays at 60 demos (the same as the physical channel), the cost per demo rises to €1,120. Scale matters.
Step 3 — Break-even by demos substituted
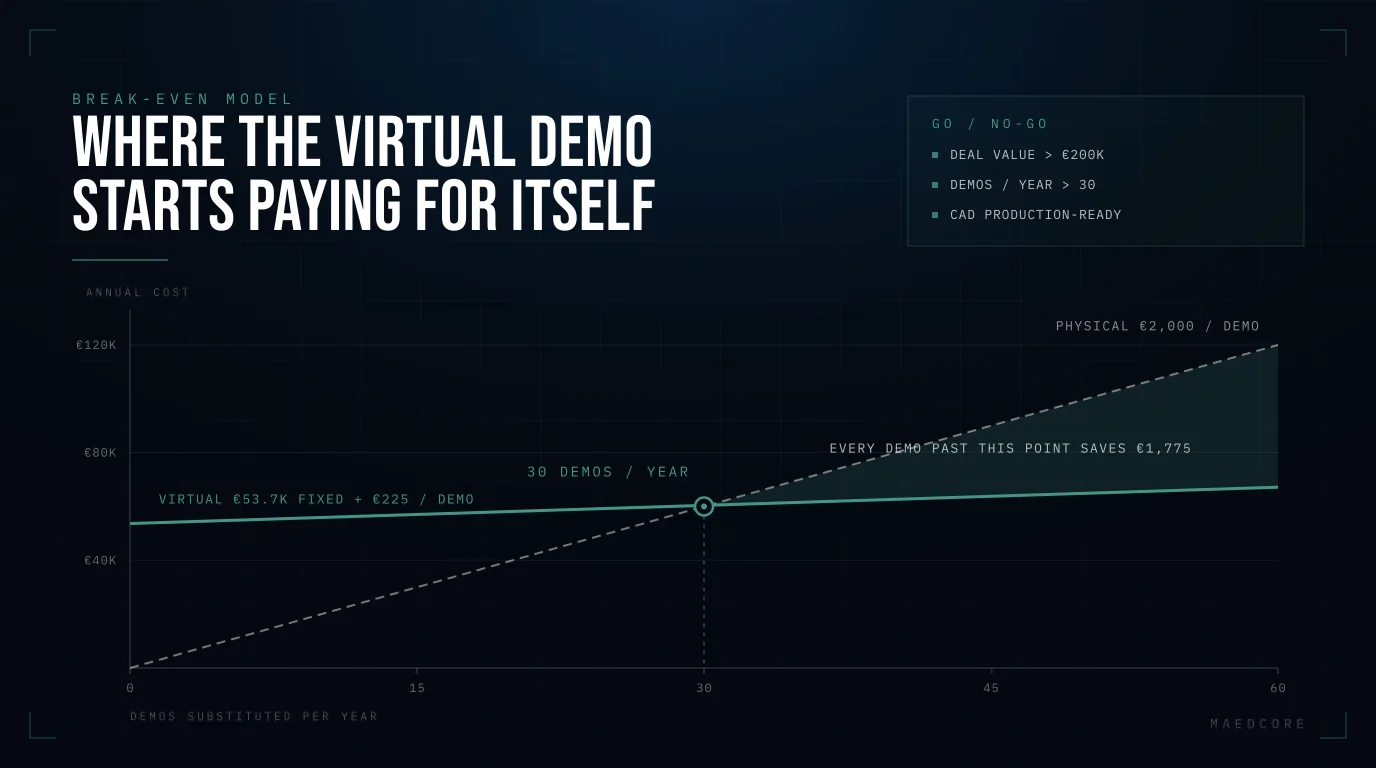
Break-even (demos) = Annual fixed cost of virtual programme
                     ÷ (Cost per physical demo − Variable cost per virtual demo)

Conservative example:
  Annual fixed cost of virtual programme:  €53,667
  Cost per physical demo:                  €2,000
  Variable cost per virtual demo:          €225
  Saving per substituted demo:             €1,775
  Break-even: 53,667 ÷ 1,775 = 30 demos/year
If the company delivers 60 physical demos a year and substitutes 30 (50%) with the virtual programme, the programme pays for itself in year one.
Step 4 — Revenue-uplift scenario (the bull case)
The 18% cycle compression from the Storylane/Factors.ai study is not applied here — that figure comes from SaaS demos with 33-day cycles. For industrial machinery, a conservative 10% compression is used, based on the buyer being able to advance the evaluation phase independently. A 1-percentage-point improvement in close rate is also assumed, driven by more decision-makers having been exposed to the demo before the final meeting.
Base assumptions:
  Current sales cycle:            130 days
  Current close rate:             10%
  Average deal value:             €400,000
  Active opportunities/year:      50

Current revenue:
  50 × €400,000 × 10% = €2,000,000/year

With virtual demo programme (conservative assumptions):
  Cycle compression:              10% → 117 days
  Close rate improvement:         +1 pp → 11%
  Additional opportunities/year:  +2 (greater geographic reach) = 52

Projected revenue:
  52 × €400,000 × 11% = €2,288,000/year
  Revenue uplift:                 €288,000/year

Programme ROI:
  Annual programme cost:          €76,167
  Net benefit:                    €288,000 − €76,167 = €211,833
  ROI = €211,833 ÷ €76,167 = 278%
Important: These numbers are illustrative with explicit assumptions. A 1-percentage-point improvement in close rate may seem modest, but on a €400,000 average deal value across 50 opportunities it equals two additional closed deals per year.
Step 5 — Go/no-go decision matrix
| Criterion | Go | Caution | No-Go |
|---|---|---|---|
| Average deal value | >€200,000 | €50,000–€200,000 | <€50,000 |
| Demos delivered/year (current) | >30 | 15–30 | <15 |
| Product configurability | High | Medium | Low/standard |
| Quality of existing CAD files | Production-ready | Require rework | No CAD |
| Sales team digital adoption | High | Medium | Low |
| Buying committee size | >5 decision-makers | 3–5 | 1–2 |
| Customer geographic spread | International/dispersed | National | Local |
A company with three or more criteria in the No-Go column should start with the lowest-cost programme type (web 3D configurator, €15,000–€40,000) before committing budget to a full VR showroom.
Step 6 — Payback in months
Payback (months) = Total build investment
                  ÷ [(Monthly demo cost saving) + (Monthly revenue uplift)]

Example:
  Build investment:                          €80,000
  Monthly saving (30 demos × €1,775 ÷ 12):  €4,438
  Monthly revenue uplift:                    €288,000 ÷ 12 = €24,000
  Payback = €80,000 ÷ (€4,438 + €24,000) = 2.8 months
This result assumes the revenue uplift materialises from month one. In practice, with 130-day cycles, the first closings attributable to the programme will take 4–6 months to appear in the P&L. A conservative scenario that ignores revenue uplift for the first six months gives a payback of 18 months on cost savings alone — a reasonable result for an investment of this nature.
Failure modes: why virtual demo programmes miss their projected ROI
The majority of virtual demo programmes that fall short of their projected ROI fail for operational reasons, not technological ones.
1. CAD not render-ready. Optimising CAD files for real-time engines is the most common bottleneck and the most consistently under-budgeted item. A project that does not audit its CAD files before signing the contract can watch 30–40% of the budget disappear into retopology work.
2. Insufficient fidelity for the technical buyer. A photorealistic demo that cannot answer “will it fit in my facility with 8 metres of clear height?” or “what is the noise level at 3 metres?” fails the engineering buyer. The demo must be integrated with the product’s real technical specifications.
3. No CRM integration = no pipeline attribution. A virtual demo programme that does not record which opportunities have interacted with it cannot prove its own ROI. CRM integration is not a nice-to-have; it is the measurement mechanism that justifies the investment to senior management.
4. Sales team non-adoption. A tool that sales engineers find slower or less convincing than the physical demo will be abandoned within three months. In our experience on industrial visualisation projects — including the sale of two rolling-mill factories using 3D animation — the determining factor for success was not the quality of the 3D asset but the integration of the tool into the existing commercial process.
5. Ignoring update costs. For industrial machinery with annual range updates, every product change means revising the 3D assets. Budgeting 15–20% of the build cost as annual maintenance is not optional.
6. Demo designed for a single channel. A demo built exclusively for a VR headset at a trade show loses the asynchronous-sharing advantage with the buying committee. The system must support saved configurations, shareable links and exportable summaries.
Frequently asked questions
How many demos a year do I need for a virtual demo programme to be cost-effective?
With a mid-range programme (€50,000–€70,000/year), the break-even point through physical demo substitution sits at around 25–35 demos annually. Below 15 demos a year, variable cost savings do not recoup the fixed investment within a reasonable timeframe; in that case, a web 3D configurator (€15,000–€40,000 build cost) is more appropriate than a full VR showroom.
Can I use engineering CAD files directly to build the virtual demo?
Not directly. Engineering CAD files (SolidWorks, CATIA, NX) contain internal geometry and polygon densities that are unusable in real-time engines without prior retopology. This work costs between €5,000 and €20,000 depending on product complexity and must be budgeted before development begins, as it is the most common cause of budget and schedule overruns.
What sales cycle compression is realistic for industrial machinery with a virtual demo?
The most-cited figure — 18% compression, from 33 to 27 days — comes from a SaaS demo study and is not applicable to industrial machinery with 130–270-day cycles. A conservative 10% compression is a more defensible assumption, derived from the buyer being able to complete the technical evaluation phase independently before the first qualified meeting. Any model applying figures above 15% for capital equipment should cite its source.
Can a virtual demo fully replace physical trade-show presence?
No. The strongest ROI comes when the virtual demo complements physical presence — extending reach between shows to remote or international buyers and accelerating buying-committee evaluation asynchronously. Treating it as a total trade-show replacement typically generates ROI expectations that are not met.
How do you attribute a closed deal to the virtual demo programme in the CRM?
Attribution requires the demo system to automatically log which opportunities have interacted with it, with which configuration and for how long, creating activities on the corresponding opportunity record (Salesforce, HubSpot, Dynamics). Without this integration, attribution depends on manual reporting by the sales engineer, which is inconsistent and systematically underestimates the programme’s real impact.
Related reading
- OmniViewer in Action: Inside Maedcore’s VR Showroom for Industrial Machinery
- Virtual Sales Demos for Industrial Machinery: How to Close Deals Without a Factory Visit
- Virtual Showroom vs. Industrial Trade Show Booth: A Real Cost and ROI Comparison
Sources
- Trade Show Costs: A Complete Breakdown for Exhibitors — BuzzImpressions (citing CEIR and EXHIBITOR Magazine), 2024–2025.
- Trade Show Budget: A Complete Guide to Exhibit Costs — PureXhibits (citing EXHIBITOR Magazine), 2025–2026.
- Trade Show Budgeting: The Real Cost of Exhibiting — ExOptions (citing CEIR and EXHIBITOR Magazine), 2026.
- Trade Show Cost: Exhibition & Booth Pricing Guide 2026 — AMW Group, 2026.
- The ROI of a Sales ROI Demo Builder: New Data for 2026 — Rep.ai (citing Storylane/Factors.ai 2024 study, n=110,257 sessions), 2026.
- Average Sales Cycle Length by Industry: 2026 — Focus Digital, 2026.
- Sales Cycle Length Statistics 2025 — SalesSo, 2026.
- Common Sales Cycles Based on Industry — Osserva.io, 2026.
- McKinsey B2B Pulse Survey 2024 — Buyer Insights — B2B Marketing Directions (summarising McKinsey B2B Pulse Survey 2024, n≈4,000), 2024.
- More B2B Buyers Are Willing to Spend Big Bucks Per Online Order — Digital Commerce 360 (reporting McKinsey B2B Pulse Survey 2024), 2024.
- The Future of B2B Sales Is Hybrid — McKinsey & Company, 2022.
- VR & AR Development Cost in 2026: Real Enterprise Pricing — VR Vision Group, 2026.
- AR VR Development Cost Breakdown: 2025 Budget Planning Tips — Nadcab Labs, 2025–2026.
- The True Cost of Building a VR App: Budget Planning Guide — Appello, 2025.
- Virtual Showroom Development for Industrial Companies — VISARD, 2024–2025.
- 3D Animation Industrial Case Study: Rolling-Mill Factory Sales — Maedcore, project case study.
About the Author
Robotics Engineer
For over a decade, I have been driven by a single mission: leveraging AI and robotics to build a world of automated production. I believe that by creating self-sufficient systems, we can empower people to refocus on what truly matters—their families and their passions. My expertise spans from winning prestigious European startup competitions to architecting complex, integrated hardware and software projects. I specialize in bridging the gap between today's industrial challenges and tomorrow's autonomous solutions.
Frequently Asked Questions
How many demos a year do I need for a virtual demo programme to be cost-effective?
Can I use engineering CAD files directly to build the virtual demo?
What sales cycle compression is realistic for industrial machinery with a virtual demo?
Can a virtual demo fully replace physical trade-show presence?
How do you attribute a closed deal to the virtual demo programme in the CRM?
Ready to transform your company?
Book a free 30-minute meeting with an engineer.