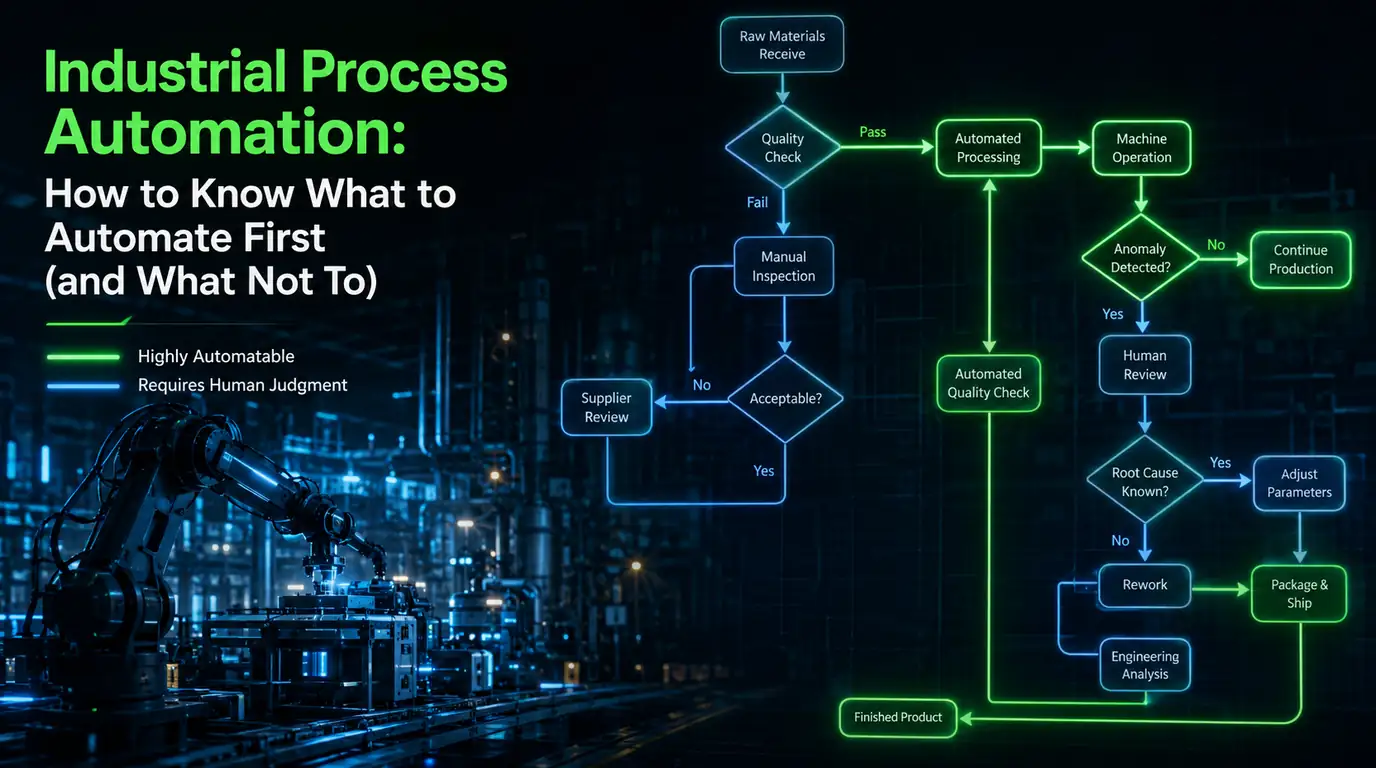
Industrial Process Automation: How to Know What to Automate First (and What Not To)
A 4-gate triage framework to identify which industrial processes to automate first, with real thresholds, ROI calculation, and a layered automation map.

Written by Eduardo Fuentevilla Blanco
Robotics Engineer at Maedcore · Robotics Engineer LinkedIn ↗
Key Takeaways
- ► If inspection post-processing consumes more than 1.5 hours per eight-hour shift (>18% of available time), that process is the first candidate for digitalisation — before evaluating any hardware.
- ► Western Europe reached a record 267 robots per 10,000 manufacturing employees in 2024 (IFR), yet a large share of industrial SMEs remain undigitalised, explaining why so many automation projects fail before they start.
- ► Automating a process with a cycle-time coefficient of variation above 25% locks chaos in at machine speed: stabilising first is the correct sequence.
- ► A 10% reduction in bottleneck cycle time increases output across the entire line by 10%; the same reduction at a non-bottleneck station produces zero throughput gain.
- ► The back-of-envelope ROI calculation (system cost ÷ displaced wage) understates true labour cost by 30–60%; well-constructed business cases achieve payback in 12–18 months.
- ► Organisations with OT/IT integration below 40% cannot realistically pursue predictive maintenance, real-time inspection, or digital twin — the three highest-ROI AI use cases in manufacturing.
Industrial process automation doesn’t start with choosing technology — it starts with identifying which process has the most to gain and which prerequisites it already meets. If inspection post-processing consumes more than 1.5 hours per eight-hour shift — over 18% of available time — that is, almost without exception, the first candidate for digitalisation, regardless of whether physical automation is feasible. This article provides a four-gate triage framework so a plant or operations manager can make that decision with their own data, not vendor promises.
Europe in 2025: Record Robot Density, Uneven Digitalisation
Western Europe reached a record 267 robots per 10,000 manufacturing employees in 2024, yet a significant share of industrial SMEs remain largely undigitalised — and that contradiction explains why so many automation projects fail before they start.
According to the IFR World Robotics 2025 report, the EU-27 averaged 231 robots per 10,000 manufacturing employees in 2024 — well above the global average of 132. Sector data from AER Automation / ISEGA shows the automotive sector alone accounted for 2,278 units installed in 2024 — nearly half the national total in Spain — while food & beverage grew 25.3% and electronics 118%.
That robotic density is concentrated in large manufacturers. The long tail of industrial SMEs — which dominates manufacturing corridors across Europe — remains largely undigitalised. The Fundación BBVA / Ivie report of July 2025 quantifies the gap: productive efficiency in high-tech-intensity manufacturing sectors more than doubled that of the least-digitalised sectors in 2022, and Spanish manufacturing R&D investment — 3.8% of gross value added — is the third lowest among eleven European countries surveyed, whose average sits at 8.7%.
What “Automation” Actually Means: The Three Layers
“Automation” is not a single thing. Confusing the layers is the most common cause of badly scoped projects and budgets that never close.
Layer 1 — Workflow and data digitalisation. Replacing paper records with structured digital capture. This is the prerequisite for everything else. Entry cost: €15,000–€60,000 for a focused inspection process (engineering estimate based on comparable deployments). Fastest payback.
Layer 2 — Embedded hardware, sensing, and machine vision. Sensor arrays, edge-computing nodes, automated optical inspection. Requires Layer 1 to be operational and OT/IT integration above a minimum threshold. Cost range: €30,000–€150,000.
Layer 3 — Physical robotics, cobots, and PLCs. Physical manipulation, automated assembly, closed-loop process control. Cost range: €80,000–€400,000 or more. This layer is outside the scope of this article: Layers 1 and 2 are the real bottleneck for most plants before they get here.
Consultancy Fluenzia puts it precisely: the logical order is first to understand the process, second to improve it by eliminating non-value-added tasks, and only then to stabilise it — before automating. Automating an unstable process locks chaos in at machine speed.
The Calculation Mistake That Ruins Most Business Cases
The most common error is dividing system cost by the displaced wage cost. That calculation understates the true labour cost by 30–60% — because it ignores social charges, absenteeism, training, and turnover — and omits quality and downtime benefits entirely.
Wiss documents this: manufacturers who build the business case on accurate prior baselines achieve positive returns in 12–18 months. Those who use back-of-envelope calculations rarely close ROI within the promised timeframe.
The Four Cost Buckets That Must Be Quantified
1. True labour cost. Direct wage × burden multiplier (1.3–1.6, per Wiss) × displaced hours × annual shifts. For an operator on a €30,000 gross annual salary, the true total cost ranges from €39,000 to €48,000.
2. Quality cost. Current defect rate × unit cost × annual volume, plus defect escapes (warranty claims, returns, customer penalties). Data from AMD Machines shows scrap reduction from 2.3% to 0.15% in a precision assembly with closed-loop inspection. These savings are frequently treated as “soft” and excluded from the ROI model. That is a mistake: the quality team already has the historical data to quantify them.
3. Unplanned downtime cost. Industry reports estimate unplanned downtime can cost up to 11% of annual revenue. For a plant with €10M in turnover, that is €1.1M per year at risk.
4. Implementation cost. Use the three-layer ranges above. Include commissioning time: a two-week planned shutdown that stretches to six weeks destroys ROI before the system produces its first part.
BuildMVPFast cites a 2024 study in which AI detected 37% more critical defects than expert human inspectors. The figure is indicative — the study is not identified by name — but the fatigue-degradation effect is well documented: an inspector at 4 a.m. is not the same inspector as at 8 a.m.
The Triage Framework: 4 Gates for Industrial Process Automation Prioritisation
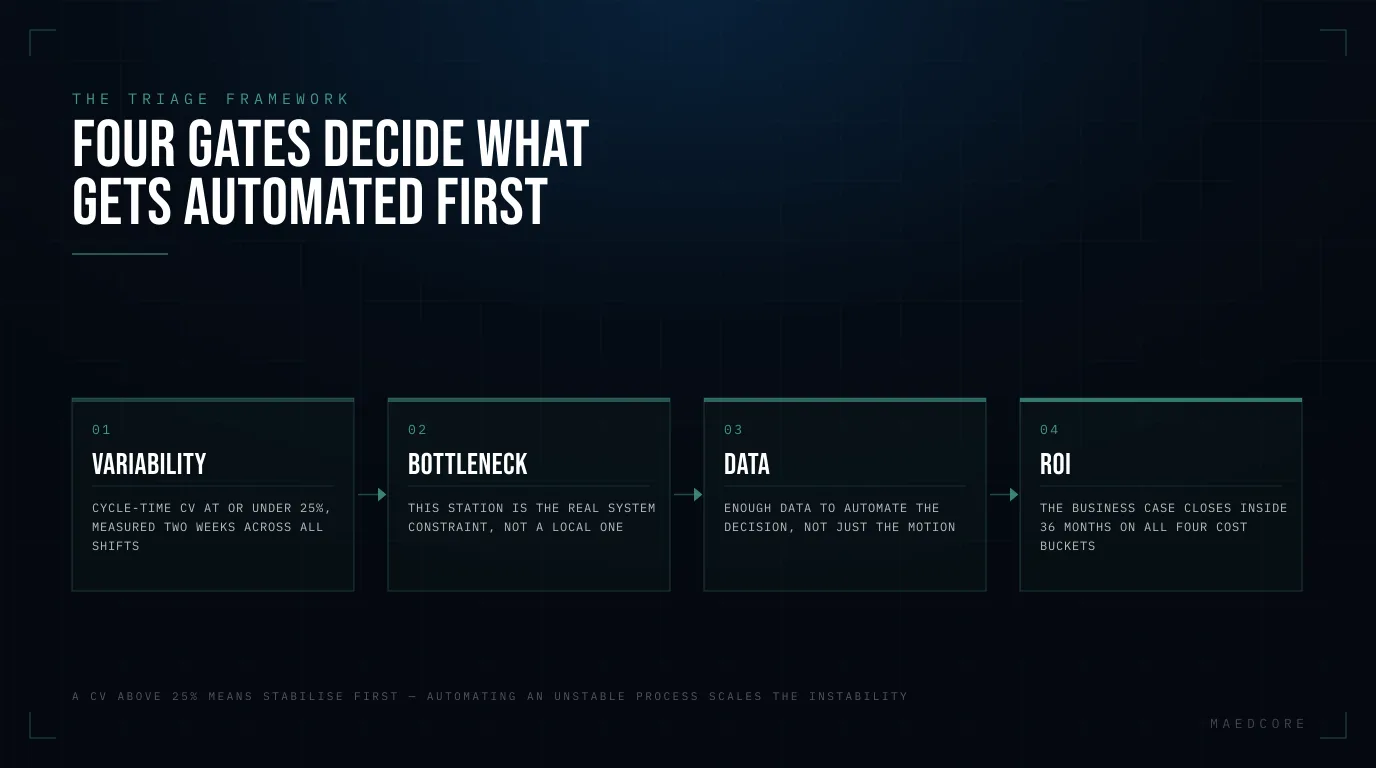
Before committing a single euro to automation, every candidate process must pass four gates in order. Skipping one doesn’t accelerate the project — it condemns it.
Gate 1 — Variability: Is the Process Stable Enough to Automate?
Metric: Coefficient of variation (CV) of cycle time, measured over at least two weeks and across all shifts.
Threshold: CV > 25% → stabilise before automating. CV ≤ 25% → proceed to Gate 2.
Lean practitioners recommend keeping cycle time 10–15% below takt time to absorb natural variation, according to Guidewheel. If no digital cycle data exists, Gate 1 already signals that Layer 1 is the first step.
Gate 2 — Bottleneck: Is This Station the Real System Constraint?
Threshold: If the candidate station is NOT the bottleneck → automating it produces zero throughput gain.
MetricGen quantifies this: a 10% reduction in bottleneck cycle time increases output across the entire line by 10%. The same reduction at a non-bottleneck station produces zero additional output. US Tech Automations adds the time dimension: a bottleneck undetected for two hours can create a full-shift production deficit that cannot be recovered without overtime.
Gate 3 — Data Availability: Can You Automate the Decision, Not Just the Motion?
Threshold A — < 50% digital capture: The first layer of automation is workflow digitalisation. There is no discussion of machine vision or edge computing: the prerequisite is not in place.
Threshold B — ≥ 50% digital capture + OT/IT integration ≥ 40%: Eligible for embedded hardware and sensing. The Thinking Company, after more than 150 manufacturing maturity assessments between 2024 and 2026, establishes that organisations below 40% on OT/IT integration cannot realistically pursue predictive maintenance, real-time inspection, or digital twin — the three AI use cases with the highest ROI in manufacturing.
The anchor threshold: If inspection post-processing — data entry, report compilation, non-conformance logging — consumes more than 1.5 hours per eight-hour shift, that station is the first candidate for digitalisation, ahead of any hardware evaluation. The structural justification: queue time accounts for 80–95% of total throughput time in most factories, according to MetricGen, and inspection post-processing is a pure contributor to that queue time.
In an inspection project we built to digitalise field mapping and inspection workflows, post-processing time dropped from several hours to minutes per campaign — exactly the kind of gain this gate is designed to surface before any hardware is proposed. The outcome is documented in the Mapper case study.
Gate 4 — ROI: Does the Business Case Close Within 36 Months?
Threshold: If the payback period exceeds 36 months under conservative assumptions → defer or descale the investment.
Worked Calculation with Explicit Assumptions
Example for an inspection line at a metalworking plant running two shifts:
| Parameter | Example value | Source / Assumption |
|---|---|---|
| Inspection operators displaced | 1.5 FTE | Plant estimate |
| Gross annual salary per FTE | €28,000 | Metal sector collective agreement |
| Burden multiplier | 1.45 | Wiss range 1.3–1.6 |
| True annual labour cost | €60,900 | €28,000 × 1.45 × 1.5 |
| Current defect rate | 1.8% | Plant data |
| Unit cost of defective part | €45 | Plant data |
| Annual volume | 120,000 units | Plant data |
| Current quality cost | €97,200 | 1.8% × €45 × 120,000 |
| Expected defect reduction | 85% | Conservative vs. AMD Machines case (2.3% → 0.15%) |
| Annual quality saving | €82,620 | €97,200 × 85% |
| Total annual benefit | €143,520 | Labour + quality |
| Implementation cost (Layer 1+2) | €75,000 | Estimated range |
| Payback period | ~6.3 months | €75,000 / €143,520 |
Caveat: Defect-reduction assumptions must be validated against your own historical data, not sector benchmarks. The AMD Machines case shows an excellent outcome in precision assembly with closed-loop inspection that is not universally replicable. For the final business case, require a validation pilot with real production data.
Gate Outcome Map
| Gate outcome | Automation layer | Recommended action |
|---|---|---|
| Gate 1 fails (CV > 25%) | Process improvement / lean | Stabilise first; automate later |
| Gate 2 fails (not the bottleneck) | Redirect to real bottleneck | Value-stream map; select the right candidate |
| Gate 3: < 50% digital capture | Workflow digitalisation (Layer 1) | Structured digital capture as first deliverable |
| Gate 3: ≥ 50% + OT/IT ≥ 40% | Embedded hardware / sensing (Layer 2) | Deploy with shadow-mode validation |
| Gate 4: ROI closes | Full deployment | Phased implementation with prior baseline |
| Gate 4: ROI doesn’t close | Defer or descale | Honesty that builds long-term trust |
What Usually Goes Wrong: Four Common Failures
1. Automating the symptom, not the cause. A high defect rate at inspection may originate in upstream process drift. Automating inspection detects more defects faster, but does not fix the root cause. A closed-loop feedback path to the upstream process is non-negotiable.
2. Underestimated installation time. Building automation off-line wherever possible and commissioning during planned shutdowns is a basic rule that is routinely broken. The automated welding head case study illustrates the right approach: mechanical design for off-line installation and shadow-mode validation before go-live.
3. OT/IT integration as the hidden bottleneck. The most common blocking point in advanced projects is the pilot-to-scale transition: OT/IT convergence takes 12–18 months to complete, according to The Thinking Company. Budgeting that time explicitly prevents surprises.
4. Treating quality savings as “soft”. Scrap, rework, warranty claims, and customer penalties are quantifiable with the historical data the quality team already holds. Excluding them from the ROI model systematically understates the business case.
How to Apply the Framework: Concrete Steps for Next Week
-
List the five processes with the highest perceived variability. Use existing shift logs or, if none exist, run a three-day manual time study. The absence of data is itself information: it signals that Gate 3 fails.
-
Calculate the CV for each candidate. Standard deviation of cycle time divided by the mean. CV > 25% → remove from the direct automation shortlist.
-
Map the value stream on a single sheet of paper. The bottleneck is where the WIP queue is longest and downstream stations are waiting.
-
Measure inspection post-processing time per shift. If it exceeds 1.5 hours, that process moves to the top of the digitalisation candidate list, ahead of any hardware evaluation.
-
Build the business case with all four cost buckets. Do not use sector benchmarks as substitutes for your own data. Require a validation pilot before committing the full budget.
Frequently Asked Questions
When does it make sense to automate inspection before other processes?
When inspection post-processing consumes more than 18% of shift time — a working threshold of 1.5 hours in an eight-hour shift — or when the defect escape rate generates quantifiable warranty claims. Inspection is a pure contributor to queue time, which accounts for 80–95% of total throughput time in most plants, making it a structurally priority candidate ahead of other stations.
What is the difference between digitalising a process and automating it?
Digitalising means capturing process events in structured, timestamped digital format — replacing paper with data. Automating means executing an action without human intervention based on that data. Digitalisation is the prerequisite for intelligent automation: without digital data there is no model to train and no alert to trigger. Many plants try to leap to automation without completing digitalisation, and that is the most common origin of failed or over-scoped projects.
How do I know whether my plant has sufficient data maturity to automate with AI?
Two practical indicators: if fewer than 50% of process events are recorded digitally with a timestamp, the first investment must be in digital capture, not hardware. If OT/IT integration is below 40%, the three highest-ROI AI use cases in manufacturing — predictive maintenance, real-time inspection, and digital twin — are not realistically achievable, according to The Thinking Company after more than 150 assessments between 2024 and 2026.
How long does it take to recover the investment in inspection automation?
When the business case is built on accurate prior baselines — with all four cost buckets properly quantified — 2025–2026 deployment data shows positive returns in 12–18 months, according to Wiss. The back-of-envelope calculation understates true labour cost by 30–60% and produces payback estimates that are rarely met in practice.
What happens if a candidate process fails one of the four gates?
Each gate has a specific redirect action: high variability (CV > 25%) means stabilise the process first; not being the bottleneck means map the value stream and select the right candidate; insufficient data means digitalisation is the first deliverable; ROI not closing within 36 months means defer or descale the investment. No outcome is a failure: the framework is designed to redirect effort to where it produces the most value.
Related reading
- Industrial Process Digitalisation — the layer model: what to stabilise before anything clever gets built on top.
- Industrial Automation and Control — what your plant already measures, and why most of it never becomes useful.
- Industrial Technology Tools — an evaluation framework for separating a real tool from a demo.
- Industry 4.0 in Practice — what the pyramid diagrams leave out: examples with numbers attached.
- Mapper Case Study — Field Inspection Digitalisation — Maedcore.
- Maedcore — Mechatronics — what we build in this area.
Sources
- World Robotics 2025 — Robot Density Surges in Europe, Asia, and Americas — International Federation of Robotics (IFR), April 2026.
- España, líder en crecimiento de robots industriales en Europa — ISEGA / AER Automation, September 2025.
- La industria manufacturera pierde una cuarta parte de su empleo — Fundación BBVA / Ivie, July 2025.
- Manufacturing Automation ROI: Financial Justification Guide — Wiss, May 2026.
- The ROI of Automated Inspection: How to Build Your 2026 Business Case — CapSen Robotics, January 2026.
- AI Quality Control: Computer Vision for Manufacturing 2026 — BuildMVPFast, March 2026.
- AI Readiness Assessment in Manufacturing — 2026 Guide — The Thinking Company, 2024–2026.
- Manufacturing Cycle Time: Formula, Benchmarks & How to Improve — MetricGen, March 2026.
- Production Line Bottleneck Detection Alerts Automated 2026 — US Tech Automations, June 2026.
- Cycle Time Optimization: A Data-Driven Approach for Operations Leaders — Guidewheel, May 2026.
- Mejora continua y automatización industrial: el orden importa — Fluenzia, May 2026.
- ROI of Robotic Automation Calculator & Payback Guide — AMD Machines, January 2024.
About the Author
Robotics Engineer
For over a decade, I have been driven by a single mission: leveraging AI and robotics to build a world of automated production. I believe that by creating self-sufficient systems, we can empower people to refocus on what truly matters—their families and their passions. My expertise spans from winning prestigious European startup competitions to architecting complex, integrated hardware and software projects. I specialize in bridging the gap between today's industrial challenges and tomorrow's autonomous solutions.
Frequently Asked Questions
When does it make sense to automate inspection before other processes?
What is the difference between digitalising a process and automating it?
How do I know whether my plant has sufficient data maturity to automate with AI?
How long does it take to recover the investment in inspection automation?
What happens if a candidate process fails one of the four triage gates?
Ready to transform your company?
Book a free 30-minute meeting with an engineer.